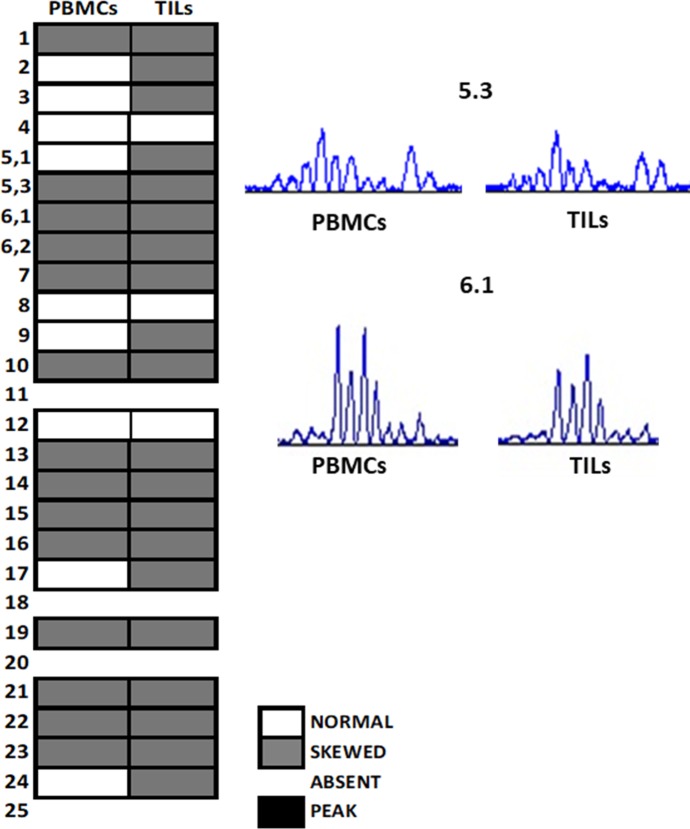
Figure 4.
Spectratypes showing BV-TCR subfamilies from PBMCs and TILs. Synoptic diagram of TCR repertoire analysed in peripheral blood and TILs of the patient. BV families were considered. The white box represents a Gaussian chromatogram (normal distribution); the grey box indicates a skewed repertoire (polyclonal response); the empty box represents the absence of amplification. Some families of PBMCs and TILs showed very similar alterations, as shown in chromatograms of 5.3 and 6.1 BV families (on the right), where the same clones seem to be expanded. BV, beta variable; PBMC, peripheral blood mononuclear cells; TCR, T lymphocyte receptor; TIL, tumour-infiltrating lymphocytes.

