Figure 2.

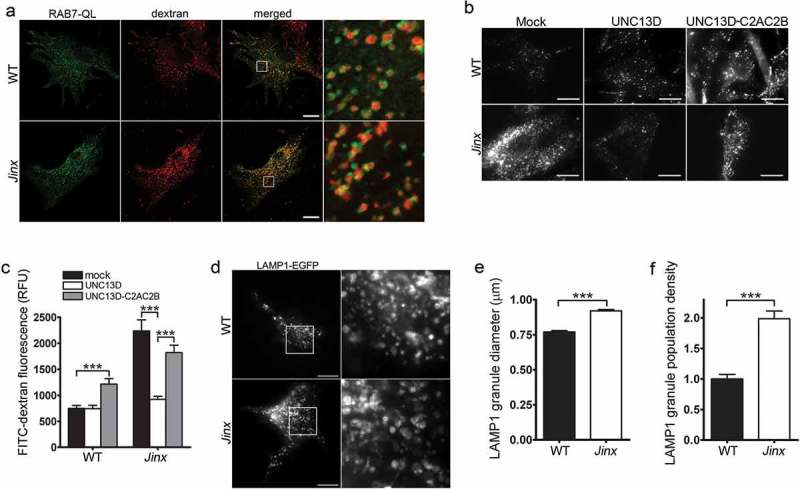
Defective endosomal cargo processing in UNC13D-deficiency is rescued by UNC13D but not by a calcium- and STX7-binding-deficient mutant. (a) Confocal microscopy analysis of the distribution of GFP-RAB7QL and dextran in wild-type (WT) and unc13d-null (Jinx) cells. Scale bar: 20 µm. After 3-hour loading and 3-hour chase dextran was observed exclusively inside RAB7-positive vesicles. (b) Analysis of endosomal cargo processing. WT and Jinx MEFs were mock transfected (mock) or transfected with vectors for the expression of mCherry-UNC13D or the calcium- and STX7-binding-deficient mutant mCherry-UNC13D-C2AC2B, with point mutations D127A, D133A, D941A and D947A to knockout the Ca2+-binding sites in the C2A and C2B domains. After 48 h, the cells were loaded with FITC-dextran at 37°C for 3 h, then washed and chased in complete medium for 3 h. Representative images of accumulated FITC-dextran in cells are shown. Scale bar: 20 µm. (c) Quantification of the results shown in (b). Results are represented as mean ± SEM. At least 60 cells from 3 separate experiments were analyzed. ***p < 0.001, Student’s t-test. RFU, Relative Fluorescence Units. (d) Representative images of pseudo-TIRFM analysis of LAMP1-EGFP-positive organelles in WT and Jinx cells. Scale bar: 20 µm. (e) Quantitative analysis of late endosomal size. Quantification was performed by measuring the diameter of LAMP1-EGFP-positive late endosomes in each cell using ImageJ. Results are represented as mean ± SEM from at least 20 cells. ***p < 0.001, Student’s t-test. (f) Quantitative analysis of late endosome population density was performed by the establishing the ratio of EGFP-LAMP1-positive late endosomes numbers in each cell per cell area. Results are represented as mean ± SEM from at least 20 cells. ***p < 0.001, Student’s t-test.
