Figure 5.

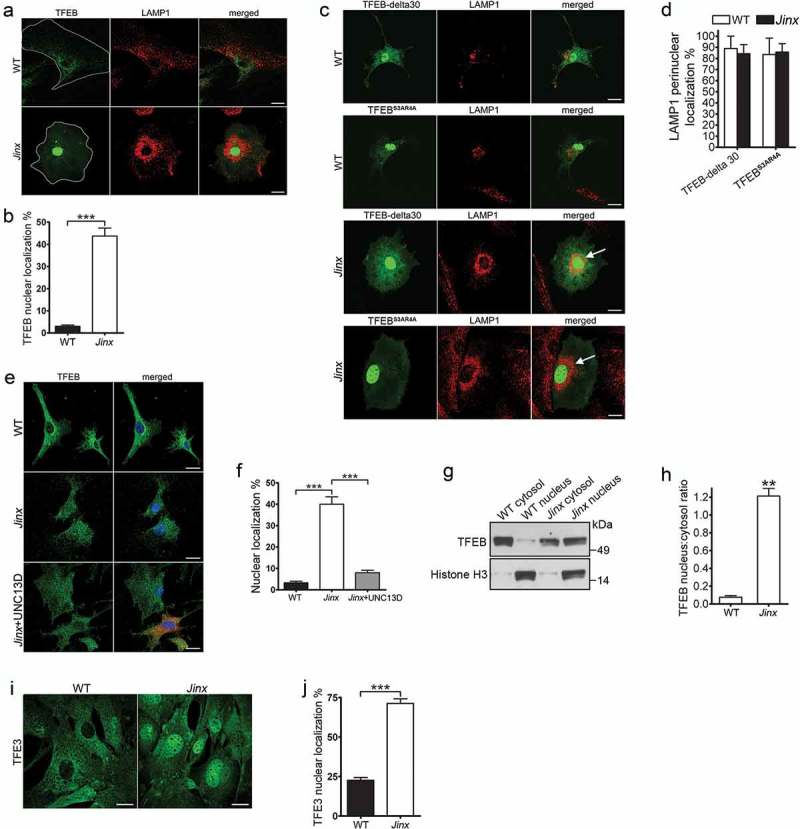
TFEB is activated in UNC13D-deficient cells. (a) Confocal microscopy analysis of the localization of TFEB and LAMP1. Wild-type (WT) and unc13d-null (Jinx) cells were transfected with a TFEB-EGFP expression vector and immuno-stained with anti-LAMP1 antibody. Representative images are shown. Scale bar: 20 µm. (b) Quantification of the distribution of TFEB-GFP in WT and Jinx cells. The data is represented as mean ± SEM. At least 20 cells for each group were analyzed. ***p < 0.001, Student’s t-test. (c) Confocal microscopy analysis of the localization of constitutively active TFEB and LAMP1. WT and Jinx MEFs were transfected with EGFP-TFEB-delta30 or EGFP-TFEBS3AR4A expression vectors and immuno-stained with anti-LAMP1 antibody. Representative images are shown. Scale bar: 20 µm. The arrows indicate the change in the distribution of LAMP1-positive puncta showing re-localization towards the perinuclear area. (d) Quantification of the data show in (c). The data is represented as mean ± SEM. At least 20 cells were analyzed. (e) Confocal microscopy analysis of the distribution of endogenous TFEB (green) and nuclei (blue) in WT, Jinx and Jinx MEFs rescued by the expressing mCherry-UNC13D (red). Scale bar: 20 µm. (f) Quantification of the data shown in E. The percentage of MEFs with nuclear localized TFEB is presented as mean ± SEM from at least 50 cells. ***p < 0.001, Student’s t-test. (g) Cytosol and nuclear fractions from WT and Jinx MEFs were analyzed by Western blot. Histone H3 was used as a marker of the nuclear fraction. (h) Quantification of the nucleus:cytosol ratio of TFEB from 3 independent experiments. The results are presented as mean ± SEM. **p < 0.01, Student’s t-test. (i) Confocal microscopy analysis of the distribution of endogenous TFE3 in WT and Jinx MEFs. Scale bar: 20 µm. (j) The percentage of cells with nuclear localized TFE3 are presented as mean ± SEM from the analysis of at least 50 cells. ***p < 0.001, Student’s t-test.
