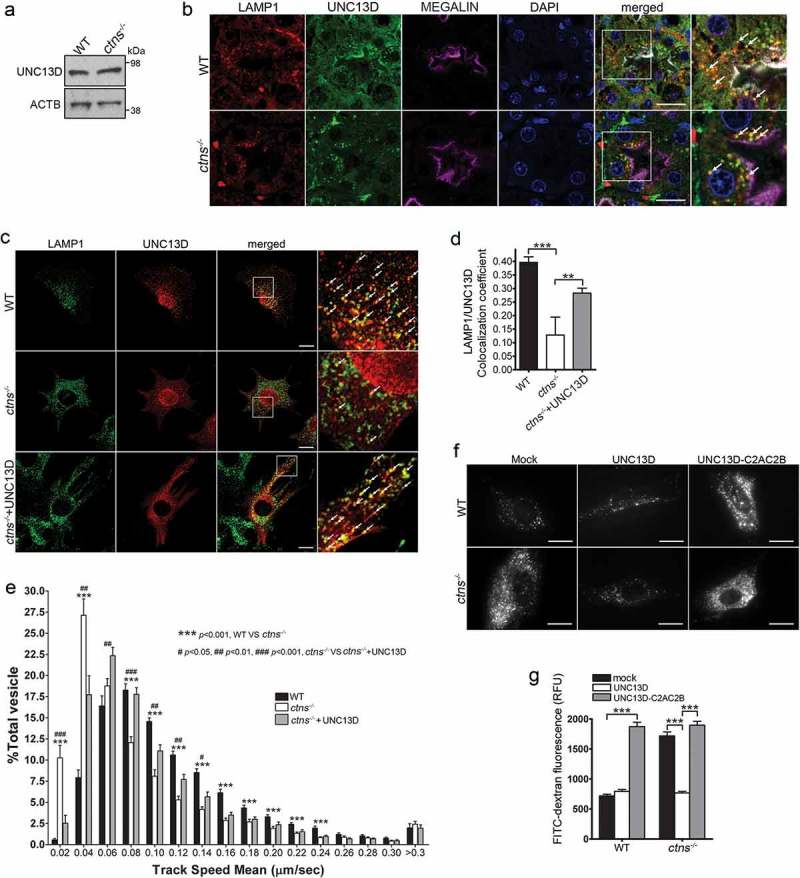
Figure 7.

UNC13D but not the STX7-binding-deficient mutant UNC13D-C2AC2B rescues the endosomal defective phenotype in cystinosin-deficient (ctns−/-) cells. (a) UNC13D expression in ctns−/- cells. The expression level of UNC13D in WT and ctns−/- MEFs were analyzed by Western blot. (b) Immunofluorescence analysis of WT and ctns−/- mouse kidney proximal tubule cells, identified by the expression of the apical receptor LRP2/megalin, and showing the distribution of endogenous LAMP1 and UNC13D. Scale bar: 20 µm. (c) Localization of UNC13D in WT and ctns−/- cells. Confocal microscopy analysis of the distribution of endogenous LAMP1 and UNC13D in WT, ctns−/- and ctns−/- MEFs expressing mCherry-UNC13D was performed as described in Material and Methods. Scale bar: 20 µm. The arrows indicate that UNC13D localizes at LAMP1-positive structures. (d) Quantitative analysis of the colocalization of LAMP1 and UNC13D in WT, ctns−/- and ctns−/-+UNC13D MEFs. Data are presented as mean ± SEM, n = 15. **p < 0.01 and ***p < 0.001. (e) Vesicular dynamics analysis of acidic endolysosomes in WT and ctns−/- cells was performed using pseudo-TIRFM. The histograms represent the track speeds of LysoTracker-labeled vesicles in WT (black bars), ctns−/- (white bars) and ctns−/- MEFs expressing mCherry-UNC13D (gray bars). The speeds of the independent vesicles were binned in 0.02 µm/s increments and plotted as a percentage of total vesicles for a given cell. Results are represented as mean ± SEM from at least 20 cells. The statistical significant differences between the groups are indicated in the figure. Student’s t-test. (f) Analysis of endosomal cargo processing in WT and ctns−/- cells. WT and ctns−/- MEFs were mock-transfected or transfected with vectors for the expression of mCherry-UNC13D or the calcium/STX7-binding-defective mutant mCherry-UNC13D-C2AC2B (described in Figure 2). The cells were used in dextran processing assays as described under Materials and Methods. Representative images of accumulated FITC-dextran in the cells are shown. Scale bar: 20 µm. (g) Quantitative analysis of fluorescent FITC-dextran represented as Mean ± SEM. At least 60 cells from 3 independent experiments were analyzed. ***p < 0.001, Student’s t-test. RFU, Relative Fluorescence Units.
