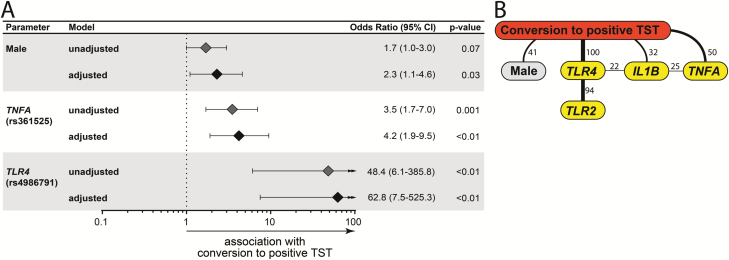
Figure 2.
Factors associated with TST conversion. A, Multivariable regression model of variables shown in Tables 3 and 4, which displayed univariate P-value ≤ .2. B, Bayesian network with bootstrap (100×) was used to illustrate the statistically significant associations between the parameters and the presence of TST conversion in the study population. Lines represent direct associations. Associations that remained statistically significant on ≥20 of 100 bootstraps are plotted. Numbers of times each association persisted during bootstrap are shown. Bold lines highlight the strongest associations. All parameters from Table 3 were included. Only those displaying significant associations are shown. Abbreviation: TST, tuberculin skin test.

