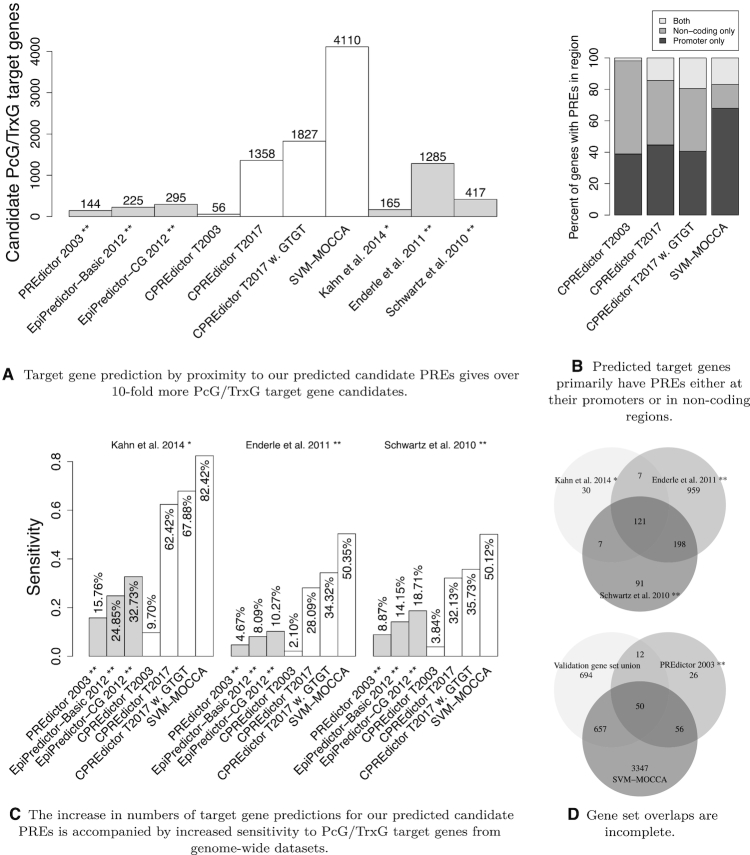
Figure 3.
PcG/TrxG target gene prediction results. (A) Numbers of target genes predicted by each algorithm, as well as in each experimentally published set. (B) Fractions of predicted target genes that have predicted PREs in either promoter regions (TSS −3 kb/+0.5 kb), in non-coding regions (not on promoters or core coding regions) or both. (C) Sensitivity of each classifier target gene prediction set to experimentally determined sets. Sensitivity is defined as the fraction of experimentally determined genes that are also predicted. * Kahn et al. (36) did not publish a set of genes, so we predicted target genes by proximity. ** Genes that were not found in the current annotation were omitted. (D) Venn diagrams of gene set overlaps for validation gene sets and target gene predictions.

