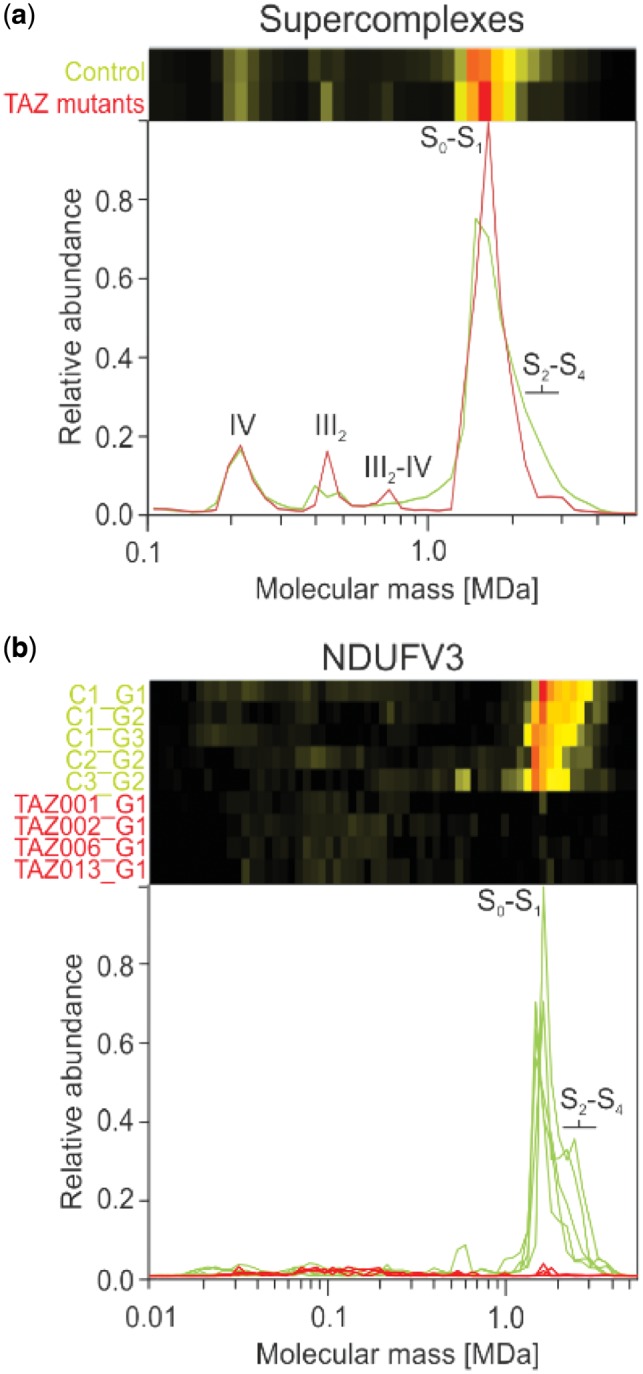
Fig. 3.

Migration pattern of oxidative phosphorylation proteins for controls (green) and TAZ mutation cell lines (red). (a) The summed intensities of all detected subunits of complexes I, III and IV show that the respiratory chain, including complex I that is part of the S0–S1 peak, remains intact in the BTHS mitochondria. Nevertheless, changes in the abundance of the complex III dimer, and S2–S4 supercomplexes are evident when comparing average profiles between BTHS mitochondria and controls. (b) Levels of the large isoform of complex I subunit NDUFV3 were severely reduced in all BTHS mitochondria profiles, with a small peak still visible at around ∼1500 kDa, which corresponds to the peak of supercomplex S0–S1. Note that there is a substantial amount of variation in the controls for NDUFV3 in the height of the high-mass shoulder diagnostic for supercomplexes S2–S4
