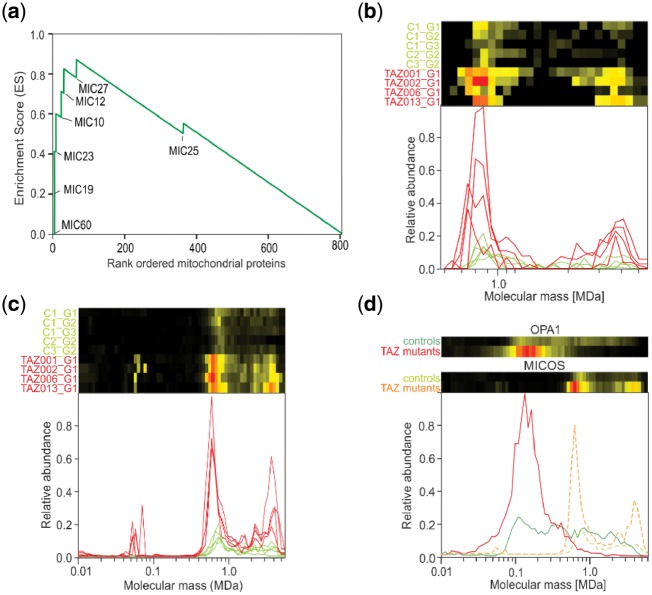
Fig. 4.
TAZ mutations significantly affect the MICOS complex. (a) GSEA shows that all MICOS complex proteins, except MIC25 that has position 381, rank high on the list of mitochondrial proteins most affected by the TAZ mutations and are part of the so-called leading-edge subset in GSEA (Subramanian et al., 2005). (b and c) Aligned migration profiles of the MICOS proteins MIC60 and MIC19, respectively. The TAZ mutations lead to an increase in the expression of both proteins and to a small shift to a lower molecular mass of the complete complex from ∼700 to 600 kDa. For MIC19 they lead to a new peak around a molecular mass of 58 kDa, potentially reflecting a new subcomplex, possibly a MIC19 dimer as the predicted molecular mass of mature MIC19 is 23 kDa. (d) Average migration profile of all MICOS proteins and OPA1 in controls and in BTHS mitochondria. The BTHS mitochondria display, relative to controls, a higher expression of MICOS proteins and a shift to a lower mass of the MICOS complex. OPA1 changes from a broad distribution in the controls to a pronounced single peak in the BTHS mitochondria centered around 100 kDa

