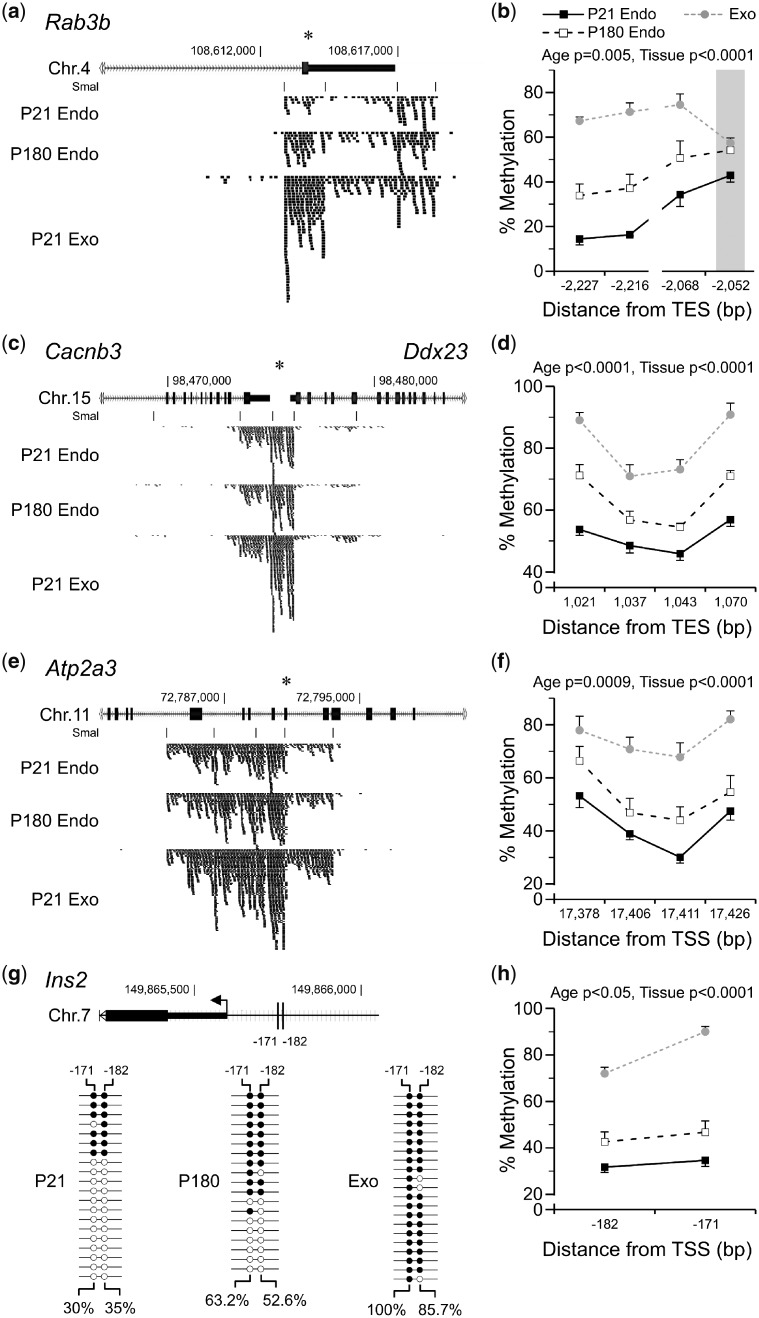
Figure 3:
validation of DNA methylation differences detected by MSA-seq in the exocrine and aging endocrine pancreas. (a, c and e) Average MSA-seq data (n = 5) for Rab3b, Cacnb3 and Atp2a3 show increased DNA methylation as islets age (P180 vs. P21) and in exocrine relative to endocrine pancreas. Each tick represents 5 MSA-seq reads; asterisks indicate SmaI/XmaI sites selected for validation (Supplementary Table S5). Bisulfite pyrosequencing confirmed these differences at Rab3b (b) (age P = 0.005, tissue P < 0.0001), (d) Cacnb3 (age P < 0.0001, tissue P < 0.0001), (f) Atp2a3 (age P = 0009, tissue P < 0.0001) and Ins2 (h) (age P < 0.05, tissue P < 0.0001). (The SmaI/XmaI site that was informative at Rab3b is indicated by a gray bar. Shown are mean ± SEM, n = 7. Interrupted lines represent multiple pyrosequencing assays.) (g) Top: the Ins2 proximal promoter region; vertical lines indicate CpG sites analysed by clonal bisulfite sequencing (−182 and −171 bp from the TSS; the only two in this region). Bottom: clonal bisulfite sequencing data in P21 islets, P180 islets and P21 exocrine pancreas. Each line represents a clone; filled and empty circles represent methylated and unmethylated CpG sites, respectively. Average site-specific % methylation values are shown. TES, transcription end site

