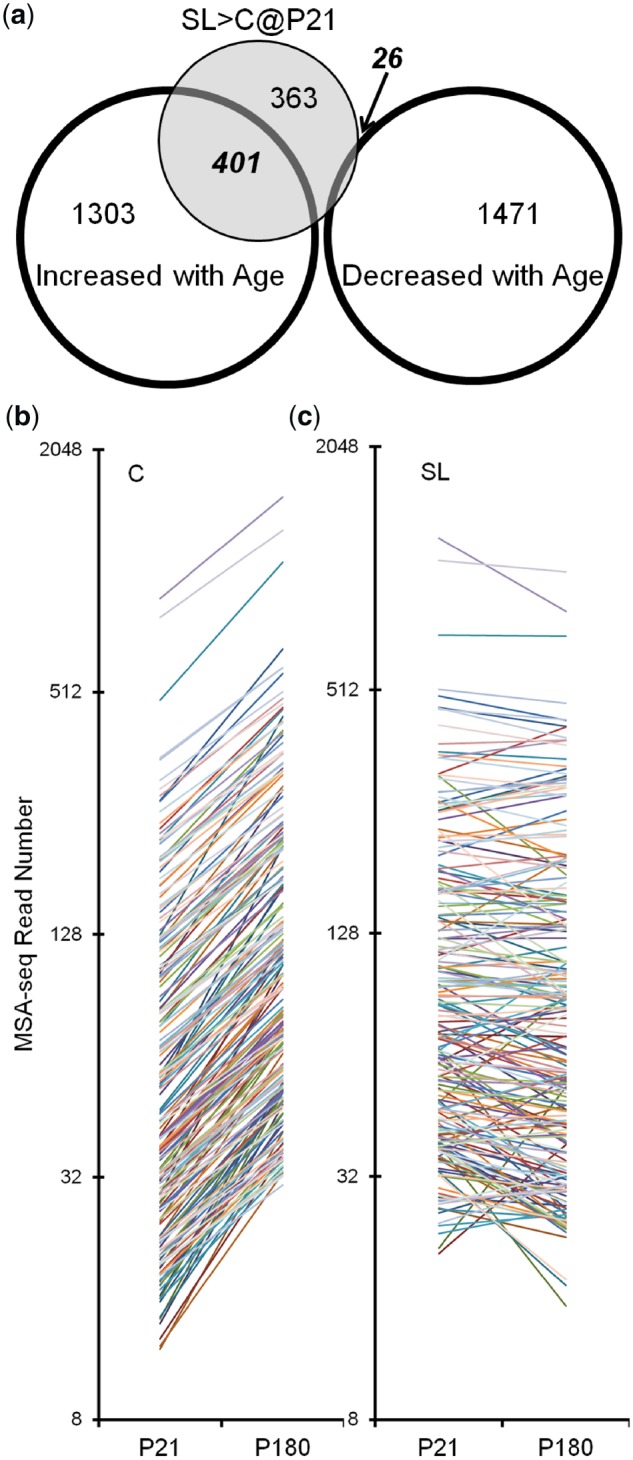
Figure 8:

significant overlap of methylated loci caused by aging and SL feeding. (a) Numbers of loci that show increased/decreased DNA methylation from P21 to P180, and those showing higher methylation in SL islets at P21. Out of 790 P21 SL > C loci, 401 also gain DNA methylation with aging (P < 0.0001 with χ2 test). (b) All 401 overlapping loci were plotted according to their MSA-seq read numbers from P21 to P180 in C (left) and SL islets (right). An obvious trend of increasing DNA methylation can be seen only in C islets.
