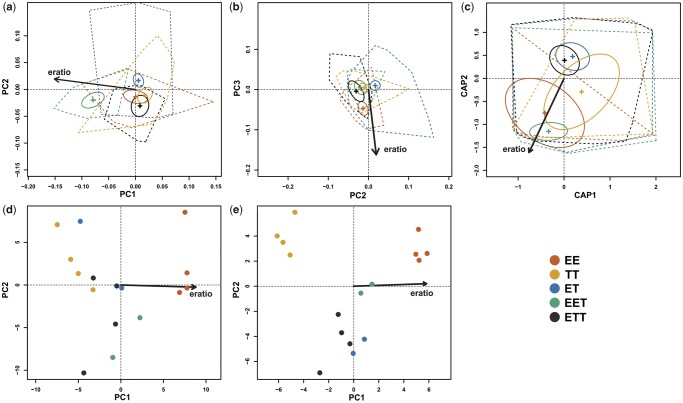
Fig. 2.
PCAs of morphological (a, b), habitat (c), RNAseq oocytes (d), and RNAseq livers (e) data. Individuals belonging to respective biotypes are marked by colors as indicated in the legend. Arrow labeled as “eratio” indicates the direction of fitted gradient defined by the proportion of Cobitis elongatoides genome in hybrid forms. Ellipses denote the confidence interval of the position of centroid for given biotype. Dotted shapes represent convex hulls enclosing positions of all individuals for given biotype. Explained variability of axes were in panels a and b: PC1 = 31.70%, PC2 = 22.46%, and PC3 = 11.27%; in panel c: PC1 = 44.21% and PC2 = 28.35; in panel d: PC1 = 28.84% and PC2 = 13.43%; and in panel e: PC1 = 23.07% and PC2 = 14.66%.

