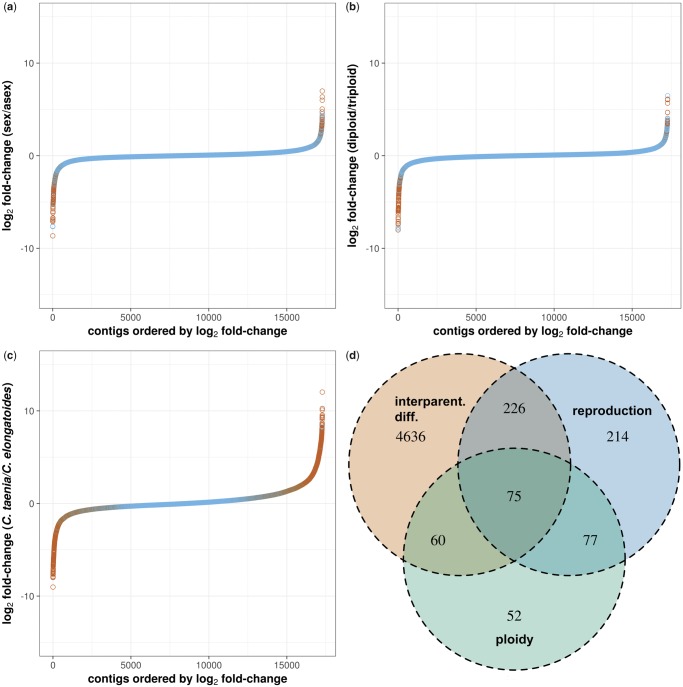
Fig. 3.
(a–c) Plots of ordered genes according to log2 FC between defined groups for oocyte tissue (red dots represent DEGs at FDR < 0.05). (d) Venn diagrams demonstrating the overlap between groups of DE genes found by ANOVA type II as significantly affected by some of the following factors: (1) interparental differentiation (assuming the individuals position along the Cobitis elongatoides—general hybrid—C. taenia continuum), (2) reproduction (sexual vs. asexual), and (3) ploidy (diploid vs. triploid).

