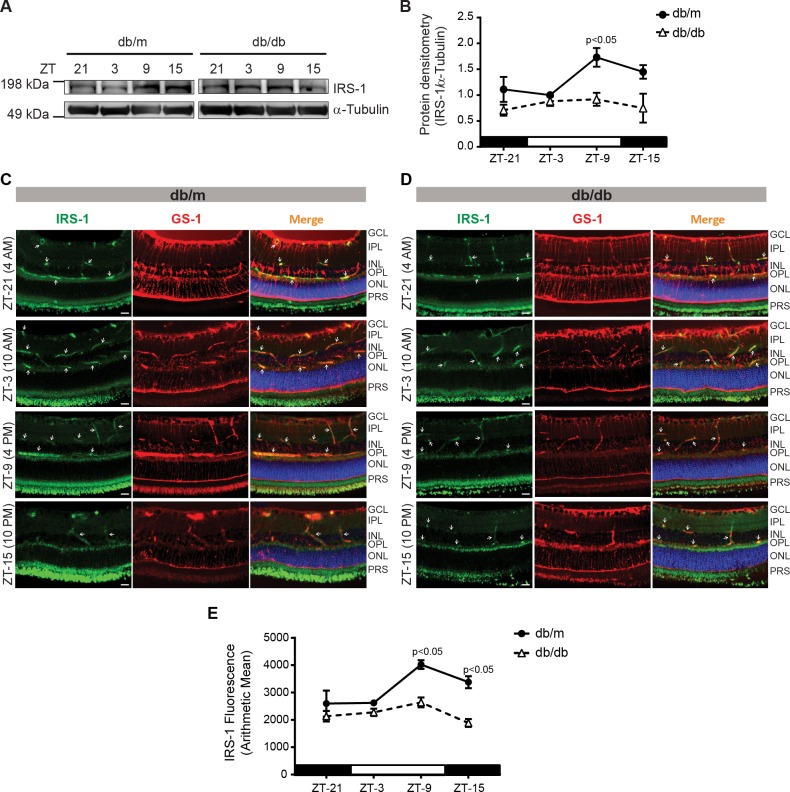
Figure 1.
IRS-1 follows a diurnal rhythm in the retina. (A) Western blot showing IRS-1 levels in db/m and db/db mice. (B) Line chart showing a peak increase in IRS-1, retinas of db/db mice did not exhibit any diurnal rhythm. Retinal slices are stained with IRS-1 (green) and glutamine synthetase (GS-1; red), representative photomicrographs showing staining pattern for IRS-1 and GS-1 in (C) db/m, (D) db/db mice, and (E) a line chart showing the quantification of immunofluorescence (n = 3).

