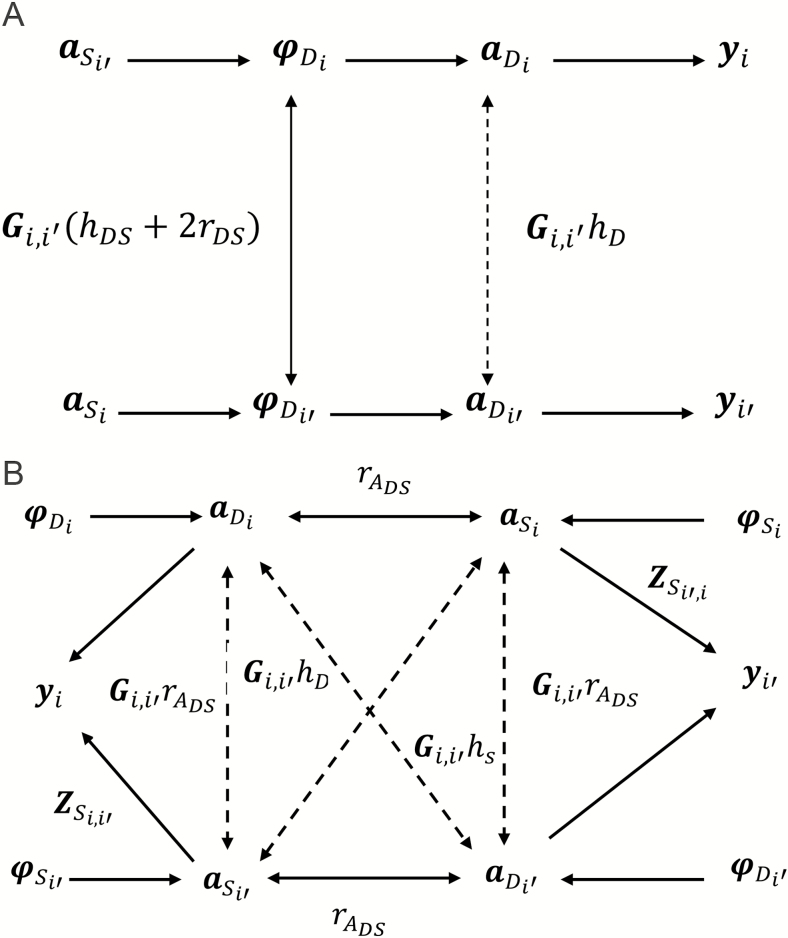
Figure 1.
(a) Path coefficient diagram or acyclic mixed graph of DGE. (b) Path coefficient diagram or acyclic mixed graph of ISGE. yi, yi′ = phenotypes of two related individuals; aD, aD′ = Direct Breeding Values for animals i and i’; aS, aS′ = Social Breeding Values for animals i and i’; = Mendelian residual for animals i and i’; Gi,i߰ = genomic relationship between animals i and i’; rDS = correlation between direct and social effects; hD = square root of direct heritability; hS= square root of , where ; = correlation between genetic direct and social breeding values; = square root of the direct heritability; , = intensity of social interaction between animals i and i’.

