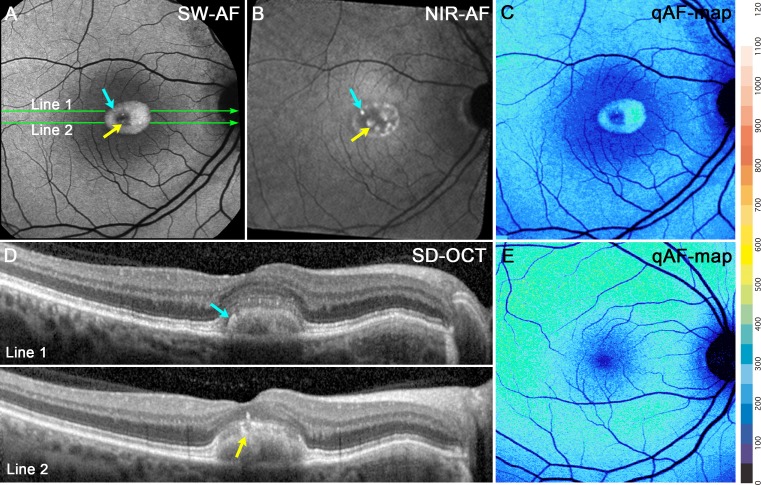
Figure 4.
Vitelliform stage. P1. (A) SW-AF. Hyperautofluorescent signal within the lesion is considerably brighter than in surrounding fundus. (B) NIR-AF. Lesion has a dark central area and hyperfluorescent puncta. (C) qAF color-coded image. Hyperautofluorescence is confined to the lesion. qAF is not elevated outside the lesion. (D) Horizontal SD-OCT scans reveal a dome-shaped lesion. At the edge of the lesion the hyperreflective bands attributable to the ELM, EZ, and IZ are displaced anteriorly, separating these bands from the RPE/BM. Within the lesion, the IZ is disorganized. The positions of the scans are indicated by green lines in (A). The AF puncta in (A) and (B) (blue and yellow arrows) correspond to hyperreflective foci in the SD-OCT scans. (E) qAF color map of a healthy eye.

