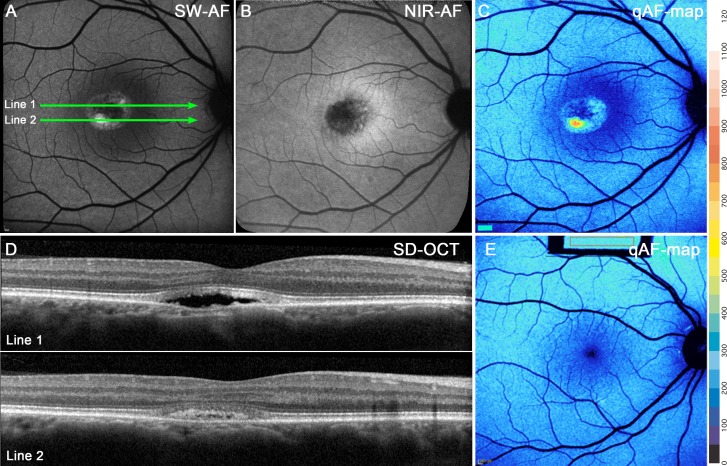
Figure 5.
Pseudohypopyon stage. P9. (A) SW-AF discloses a lesion with hyperautofluorescence that is more pronounced inferiorly. (B) NIR-AF presents a dark central lesion with AF foci. The lesion is surrounded by hyperautofluorescence that is typical of the macula. (C) qAF color-coded image reveals an intensely AF punctum within the lesion. (D) The SD-OCT scan. The ELM and EZ bands follow the anterior contours of the lesion. The hyperreflective IZ is disorganized within the lesion. The optical clarity of the lesion is consistent with fluid in the line 1, while photoreceptors outer segment debris are likely the source of the dense deposits in the inferior region (line 2). The positions of the scans are indicated by green lines in (A). (E) qAF color-coded image acquired from an age-similar healthy eye demonstrates that qAF outside the lesion in (C) is within the normal range.

