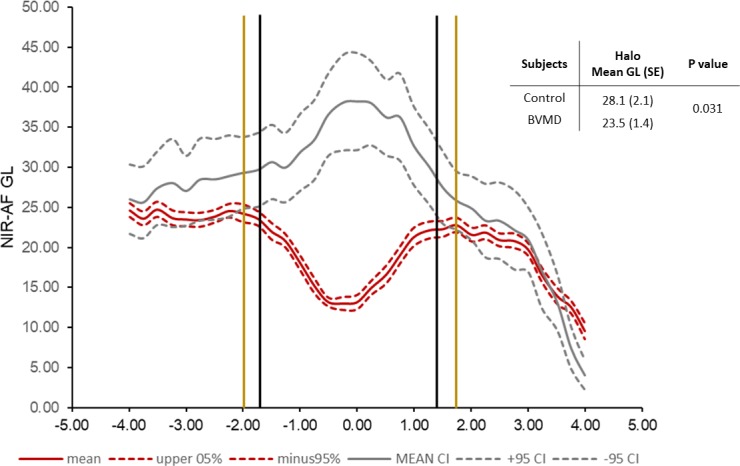
Figure 10.

Semiquantitative NIR-AF intensity profiles. Mean (solid lines) and 95% confidence intervals (dashed lines); 28 eyes. Gray lines represent healthy control eyes and red lines indicate BVMD patients. Black vertical lines are the limits of the lesion, and the yellow vertical lines are the approximate limits of the halo. Upper right, within the halo mean GLs in the control versus BVMD eyes are significantly different (P = 0.031).
