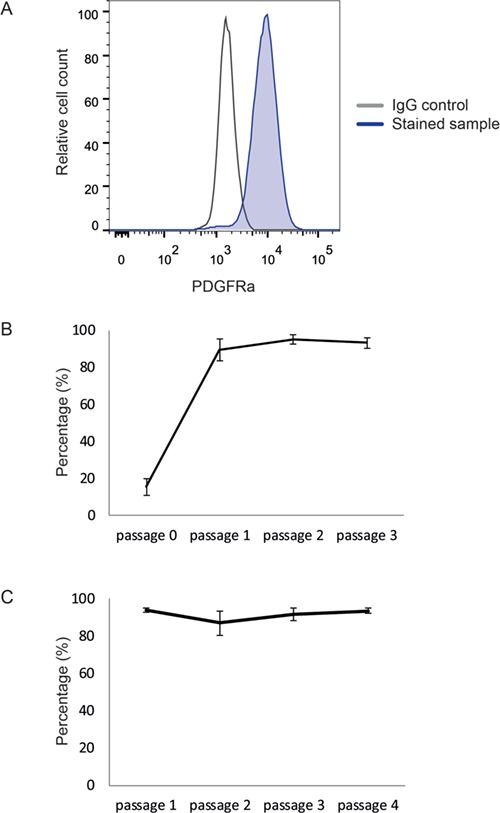
Figure 2.

Identification and propagation of PDGFRα + cells from human testicular ICF cells. Flow cytometry analyses showing a clear PDGFRα+ cell population. The stained sample (blue) clearly separates from the IgG control (gray) (A). The percentage of PDGFRα+ cells was determined at every passage during culture of ICF cells (biological replicates n = 3) (B). The percentage of PDGFRα+ cells was determined at every passage during culture of the PDGFRα+ cells after sorting (biological replicates n = 4) (C).
