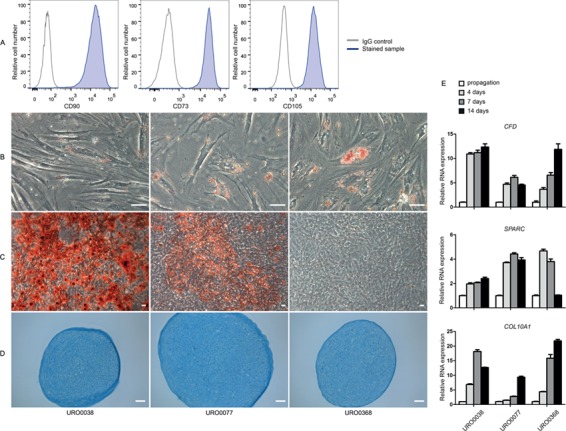
Figure 3.

MSC characteristics of HLA-A,B,C + /CD34 − /PDGFRα + cells. PDGFRα+ cells are positive for MSC minimal criteria markers CD90, CD73 and CD105 (blue) compared to IgG controls (gray) (A). Staining for trilineage differentiation of HLA-A,B,C+/CD34−/PDGFRα+ cells into adipocytes (Oil red O) (B), osteocytes (alizarin red) (C) and chondrocytes (alcian blue) (D). Scale bar is 50 μm. Relative gene expression of CFD for adipocytes, SPARC for osteocytes and COL10A1 for chondrocytes (E). Error bars indicate technical variation (n = 3). MSC: mesenchymal stromal cell; CFD: complement factor D; SPARC: secreted protein acidic and cysteine rich; COL10A1: collagen, type X, alpha 1.
