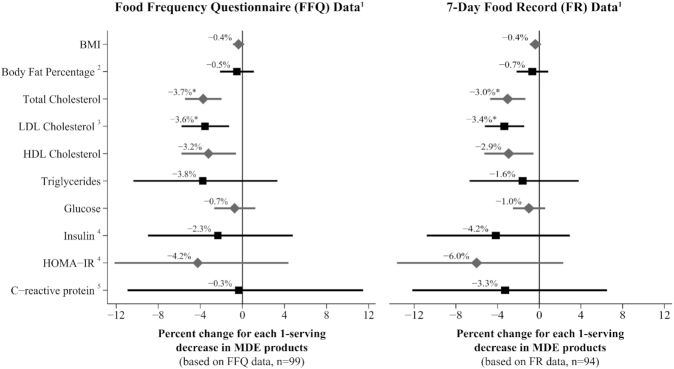
FIGURE 1.
Percent change in cardiometabolic health markers for each 1-serving decrease in meat, dairy, and egg (MDE) products (based on model 1).1Multiple linear regression results for the association between the change in health biomarkers and change in MDEΔ score [as measured by FFQs or 7-d food records (FRs)], controlling for natural log-transformed baseline biomarker value, baseline MDE score, baseline calories, change in calories, age, sex, baseline BMI, average metabolic equivalent values (METs), change in METs, and number of days on the MDE restricted diet at the time of the Lenten biomarker collection. Confidence intervals are calculated using robust standard errors. 2Excluding 2 individuals with missing body fat measurements. 3Excluding 1 individual with an unreliable LDL measure at the Lenten follow-up due to triglycerides >400 mg/dL. 4Excluding 16 individuals with missing insulin measures at 1 or both time points. 5Excluding 17 individuals with missing C-reactive protein measures or inconsistent use of anti-inflammatory medication. *Significant at a Bonferroni-adjusted α level of 0.005. HOMA-IR = glucose (mg/dL) × insulin (μU/mL)/405.

