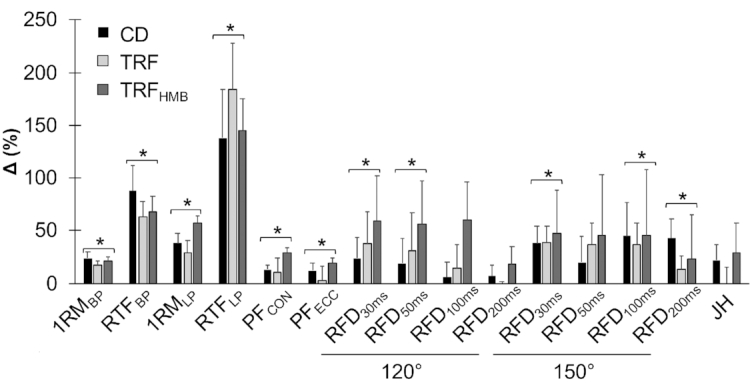
FIGURE 4.

Muscular performance changes. Results from intention-to-treat analysis are displayed [n = 40 (CD: n = 14; TRF: n = 13; TRFHMB: n = 13)], and data from per protocol analysis are displayed in the online supporting material. Percent changes (mean + SE) displayed as differences between W0 and W8 values relative to W0 values for each variable. Asterisks with brackets indicate significant changes in all groups (i.e., time main effects), with nonsignificant differences between groups, based on mixed model analysis and follow-up tests. Muscular strength and endurance were evaluated on the hip sled (leg press) and bench press exercises, peak forces were obtained from isokinetic squat testing, rate of force development was obtained from isometric squat testing, and jump height was calculated using force platforms. 120°, 120° knee angle for isometric squat testing; 150°, 150° knee angle for isometric squat testing; 1RMBP, 1-repetition maximum on bench press; 1RMLP, 1-repetition maximum on leg press; CD, control diet; JH, jump height; PFCON, peak concentric force on mechanized squat; PFECC, peak eccentric force on mechanized squat; RFD, rate of force development (durations over which RFD values were calculated are shown in subscripts); RTFBP, repetitions to failure on bench press; RTFLP, repetitions to failure on leg press; TRF, time-restricted feeding; TRFHMB, time-restricted feeding plus β-hydroxy β-methylbutyrate supplementation.
