
Fig. 1.
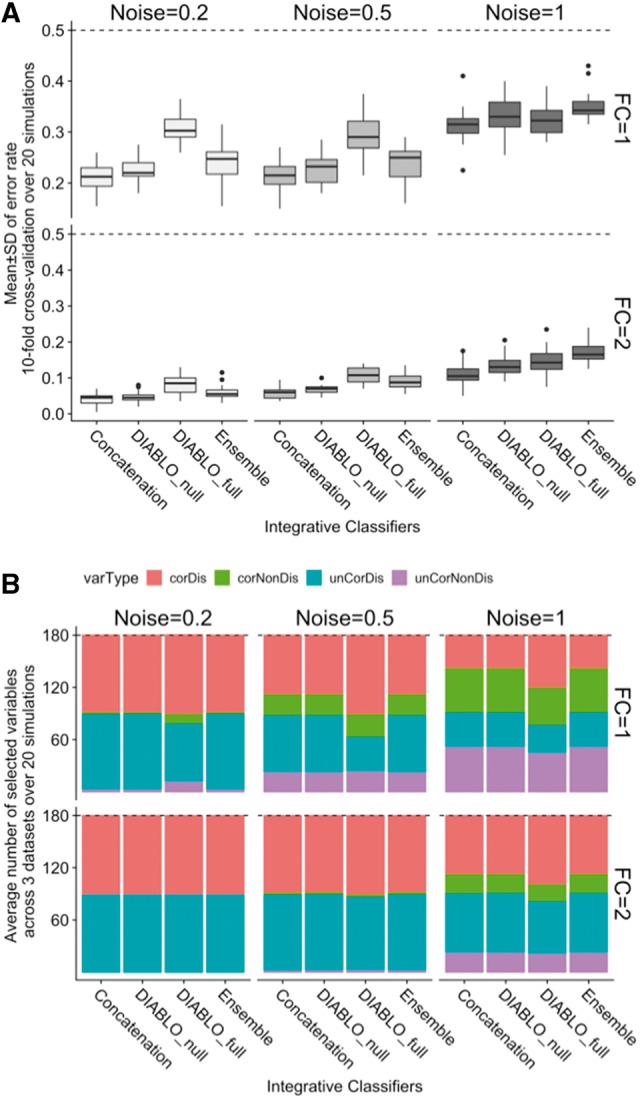
Simulation study. (A) Classification error rates (10-fold CV averaged over 20 simulations) for different FCs between groups and varying level of noise (SD). Dashed line indicates a random performance (error rate = 50%). (B) Types of variables selected by the different classification methods amongst the 180 variables selected for each classification method