
Fig. 2.
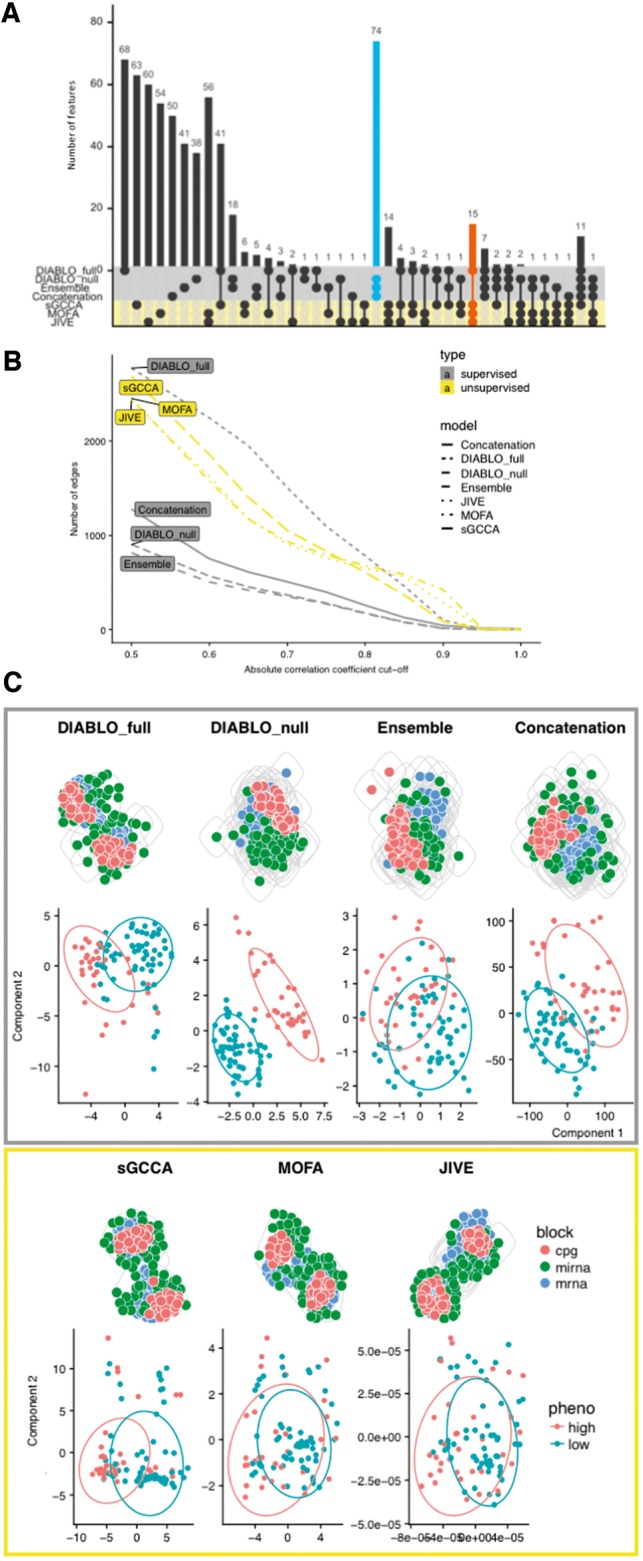
Benchmark for colon cancer. (A) Number of selected features overlapping between supervised and unsupervised methods. (B) Number of correlated variables in the biomarker panels for various Pearson correlation cutoffs. (C) Top: network modularity of each multi-omics biomarker panel. Gray circles depict modules based on the edge betweenness index from the igraph R-library. Bottom: consensus component plots depicting the separation of subjects in the high and low survival groups. Similar patterns were observed for kidney, gbm and lung cancer datasets, see Supplementary Figures S5–S10