
Fig. 4.
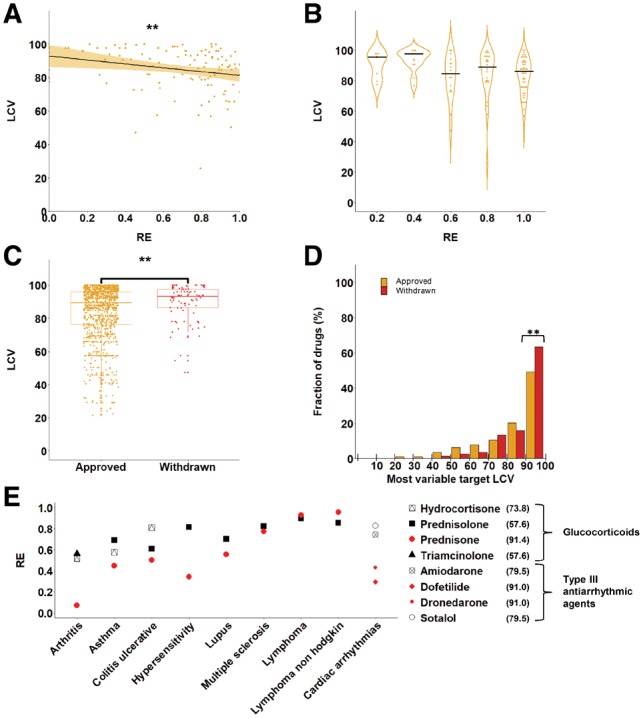
Expression variability of drug targets is linked to drug effectiveness. (A) The RE of 113 drugs is plotted against the expression variability (LCV) of their most variable target gene, showing a mild but significant negative correlation between RE and LCV (r = −0.29, P = 0.0018, Spearman correlation). (B) Analysis of 113 drugs shows that the LCV of drug target genes for drugs with similar RE values shows that less effective drugs (RE below 0.4) tend to have highly variable targets (LCV > 90). (C) The expression variability of drug target genes is shown for the disjoint sets of 1033 approved drugs and 86 drugs that were withdrawn from the market. Each dot represents the most variable target of the drug. The targets of withdrawn drugs are significantly more variable than the targets of approved drugs (P < 0.005, Mann-Whitney U test). (D) The distribution of 1033 approved drugs (gold) and 86 withdrawn drugs (red) according to the LCV of their most variable target shows that 64% of the withdrawn drugs have highly variable genes (LCV > 90) relative to 49% of the approved drugs. ‘**’ denotes hypergeometric P = 0.0097. (E) The RE of eight different drugs, including four glucocorticoids indicated for eight diseases, and four Type III antiarrhythmic agents indicated for cardiac arrhythmias. Each symbol represents a different drug and is colored in red if a target of the drug has a highly variable expression (LCV > 90, appearing in parenthesis per drug). In seven of the nine diseases the drugs with the highly variable targets have the lowest efficacy (Color version of this figure is available at Bioinformatics online.)