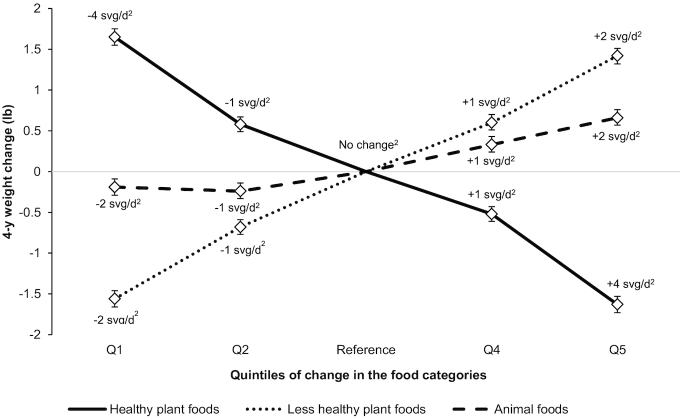
FIGURE 1.
Weight change over 4-y periods according to quintiles of change in animal foods and healthy and less-healthy plant foods. Values are weight change in lb (95% CI) pooled across the cohorts through the use of a fixed-effects model. Given that most participants gained weight over 4-y intervals, inverse associations of the diet indices with weight change (i.e., negative values) should be interpreted as “less weight gain,” not as “weight loss.” We used multivariable generalized linear regression models (with unstructured correlation matrix and robust variance) to conduct this analysis. Adjusted for age, questionnaire cycle, baseline BMI, change in smoking status, baseline and change in physical activity, hours of sleep, hours of sitting and watching television, change in alcohol consumption, change in margarine intake, and for women only, baseline parity, menopausal status, postmenopausal hormone use, and oral contraceptive use (NHS2 only). All 3 food categories were entered simultaneously into the fully adjusted model. All P values <0.001. 1 lb = 0.45 kg. NHS, Nurses’ Health Study. 2Median change in each quintile (averaged across the 3 cohorts).

