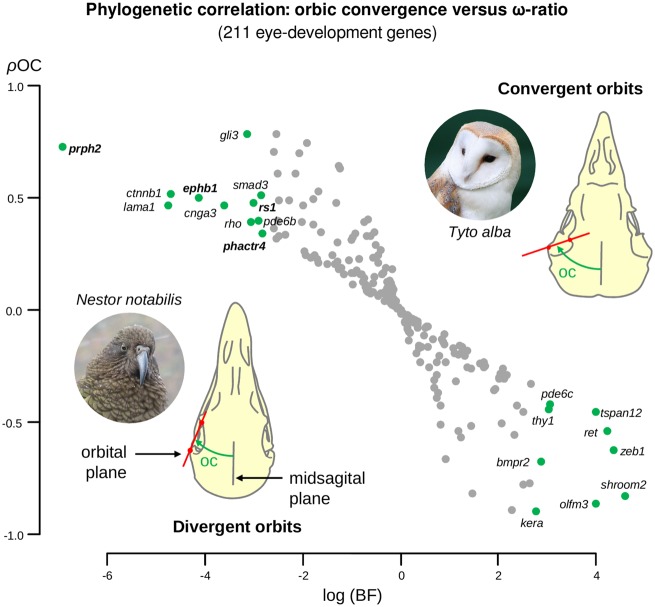
Fig. 3.
—Phylogenetic correlation between the orbit convergence and the ω-ratio of the 211 avian eye-development genes. Pearson’s correlation coefficient (ρOC) between the orbit convergence and ω-ratio of the 211 eye-development genes is plotted in the vertical axis. The horizontal axis represents the logarithm of the Bayes factors (BF) calculated under both of the hypotheses: ρOC >0 (positive association, upper left quadrant) and ρOC <0 (negative association, lower right quadrant). Green circles indicate genes with evidence of having a phylogenetic correlation with the orbit convergence at a BF threshold of 15. Genes in bold (ephb1, phactr4, prph2, and rs1) evolved under relaxed selection (see fig. 2) in the barn owl lineage. Photos of the barn owl (credits: Peter Trimming) and kea (Nestor notabilis; credits: Markus Koljonen) taken from Wikipedia under the GNU Free Documentation License.

