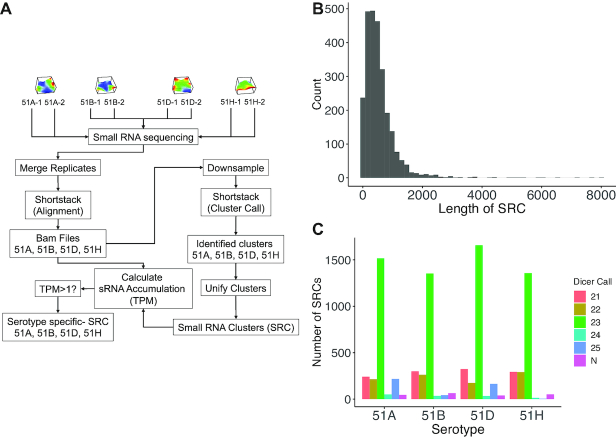
Figure 1.
(A) Overview of the small RNA cluster (SRC) generation workflow. The first row visualises the different serotypes according to a transcriptome analysis done in (27). (B) Length distribution of SRCs. (C) Number of serotype specific SRCs (y-axis) detected in the WT serotype samples (replicates were merged), stratified according to the predominant small RNA length (dicer call), where N means that no predominant length could be found.

