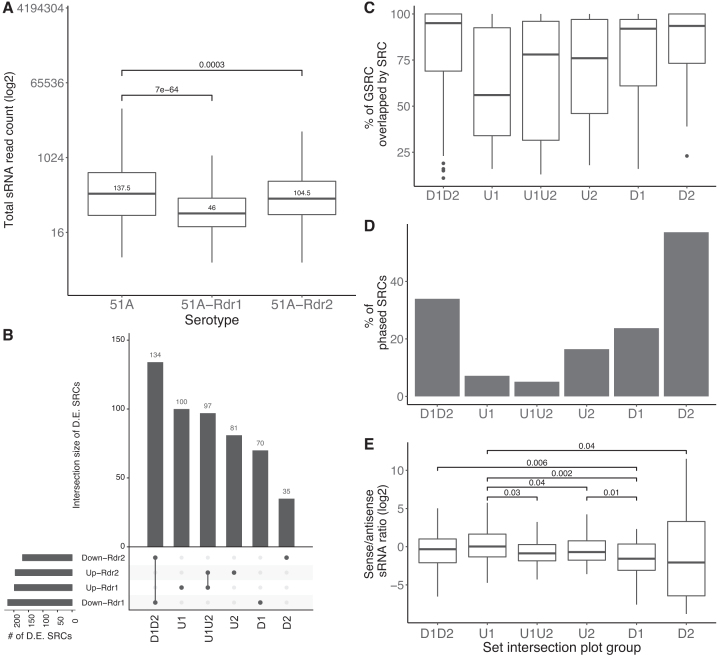
Figure 4.
(A) Box plots of the total small RNA read counts (y-axis; log2) from the WT, and mutant samples (Mutants: 51A-Rdr1, and 51A-Rdr2). The P-values indicated are from two-tailed wilcoxon test. (B) Set intersection plots for Differentially Expressed (D.E.) SRCs identified by DESeq2 in the mutant samples. We name the intersection groups as shown here (D - Downregulated, U - Upregulated, 1, 2 represents the mutant 51A-Rdr1 and 51A-Rdr2, respectively). For these intersection groups, we show the overlap percentage of GSRC by SRCs (C), the percentage of phased SRCs (D) and the sense/antisense ratio (y-axis; log2) in WT (E) here. In (E) the P-values (one-tailed wilcoxon test) are indicated for only groups with statistically significant differences.

