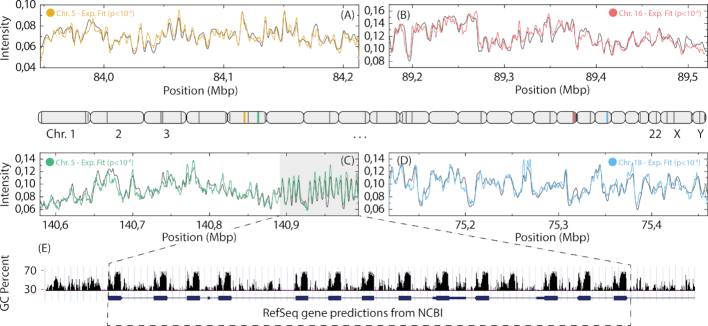
Figure 4.
Fits of experimental barcodes of single DNA molecules to the human genome. Four examples (A–D) of experimental barcodes mapped to the human genome (10 frames, 5% stretch, 1% steps). The light gray area in (C) highlights a repetitive sequence which is shown in more detail in (E). The approximate positions of the fits for all DNA molecules passing the P-value threshold (P< 10−6) are shown as dark gray lines (colored lines mark positions for barcodes shown in the figure) on a schematic illustration of the human genome (center). (E) RefSeq genes (blue) and GC content (black) for the repetitive region found in (C). The GC sequence content is displayed with a 5bp window.

