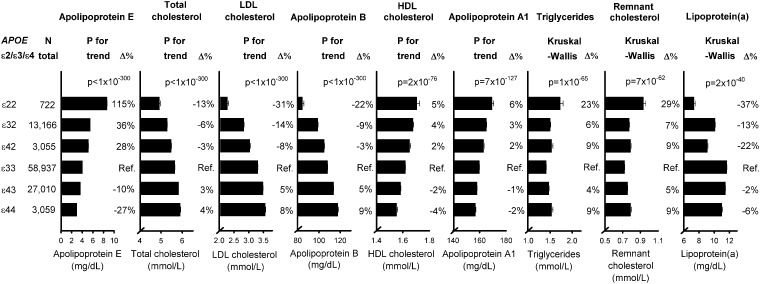
Figure 2.
Plasma levels of lipids, lipoproteins, and apolipoproteins as a function of APOE genotype. Geometric mean ± standard errors of the mean are given for apolipoprotein E, triglycerides, and lipoprotein(a); arithmetic mean ± standard errors of the mean are given for total cholesterol, LDL cholesterol, apolipoprotein B, HDL cholesterol, apolipoprotein A1, and remnant cholesterol. APOE ɛ2/ɛ3/ɛ4 genotypes are ordered according to decreasing plasma apoE levels. Differences in plasma levels of lipids, lipoproteins, and apolipoproteins are given in percent (Δ%); ɛ33 serves as the reference. P for trend (from ɛ22 to ɛ32 to ɛ42 to ɛ33 to ɛ43 to ɛ44) or the Kruskal–Wallis analysis of variance are given. APOE, APOE ɛ2/ɛ3/ɛ4 genotype; HDL, high-density lipoprotein; LDL, low-density lipoprotein; Ref, reference.

