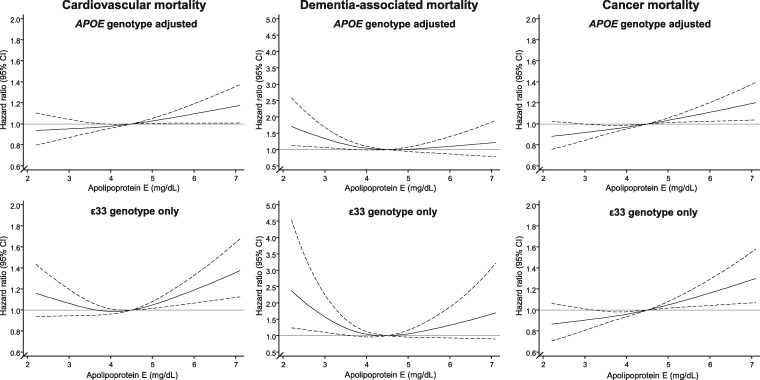
Figure 4.
Multifactorially adjusted hazard ratios for cause-specific mortality according to plasma levels of apoE in individuals in the general population. Solid lines are hazard ratios, whereas dashed lines indicate 95% confidence intervals derived from restricted cubic spline regression models similar to Figure 3 with respect to reference (4.5 mg/dL) and truncation (2.1–7.1 mg/dL). Cox regression models were multifactorially adjusted similar to Figure 3, with additional adjustment for APOE genotype in upper panels and with analyses restricted to ɛ33 carriers in bottom panels. 95% CI, 95% confidence interval; APOE, APOE ɛ2/ɛ3/ɛ4 genotype; ɛ33, APOE wildtype carriers.

