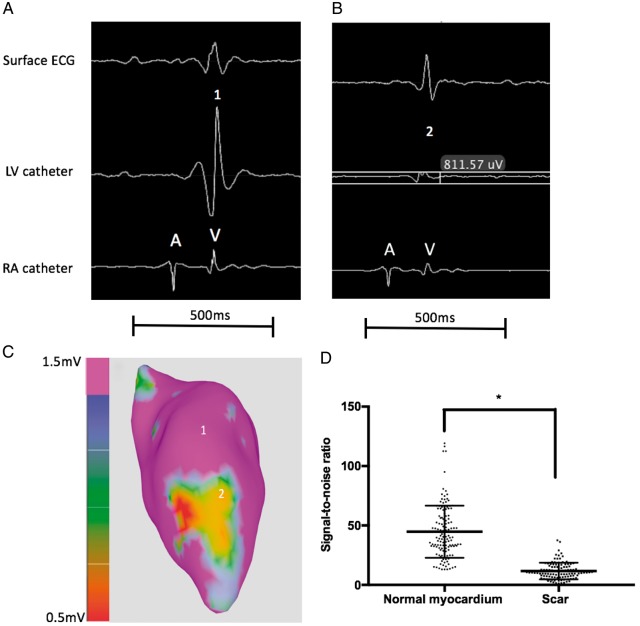
Figure 3.
Representative examples of intra-cardiac EGMs obtained using the MR-EP system in a region of normal myocardium (Point 1) and area of scar (Point 2) (A–C). The baseline noise level inside the MRI scanner was in the region of 0.1 mV (∼10-fold higher than that in the conventional electrophysiology laboratory). Dot plot showing signal-to-noise ratios obtained for intra-cardiac EGMs in normal myocardium and LGE-derived scar regions from 7 animals; *P < 0.0001 (D). EGMs, intra-cardiac electrograms; LGE, late gadolinium enhancement; LV, left ventricular; MR-EP, magnetic resonance imaging-guided electrophysiology; MRI, magnetic resonance imaging; RA, right atrium.

