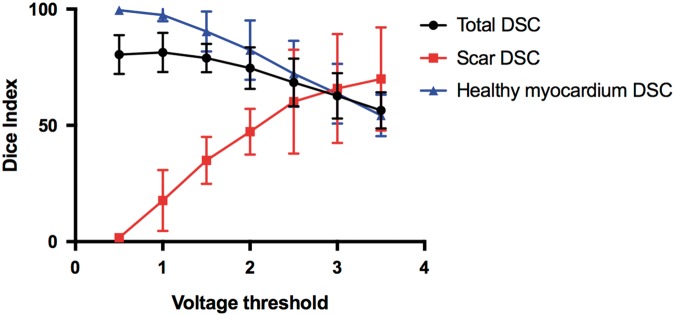
Figure 7.
DSCs between MR-derived scar shells and endocardial voltage maps acquired using MR-EP system following application of normal cut-off thresholds of 0.5–3.5 mV. DSC is shown for overall similarity, similarity across scar nodes and normal myocardium nodes. DSC, Dice similarity co-efficients; MR, magnetic resonance; MR-EP, magnetic resonance imaging-guided electrophysiology.

