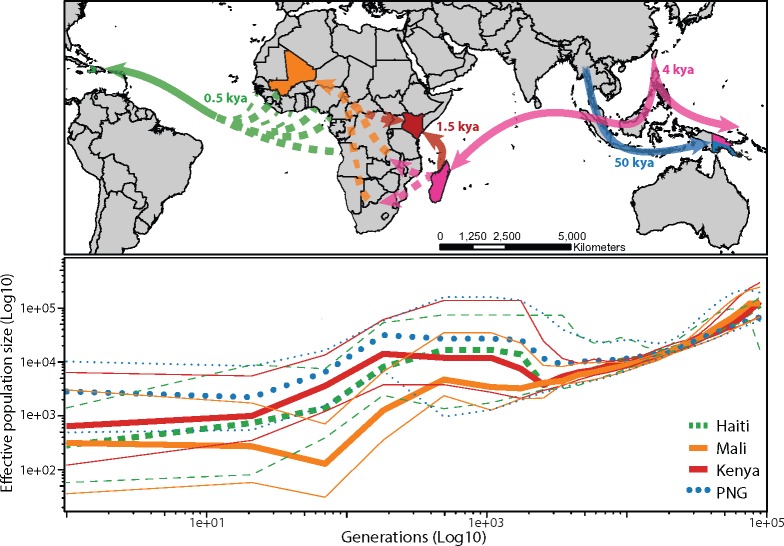
Fig. 2.
Demographic history of Wuchereria bancrofti. (A) Map representing potential routes of Wb dispersal highlighting sampled populations and shared ancestry: Haiti (green), Mali (orange), Kenya (red), Papua New Guinea (blue). Pink colors represent unsampled and thus inferred population ancestry connecting Wb populations (color figure available online). (B) Reconstruction of change in effective population size for each Wb population using MSMC2 and PopSizeABC. Thinner shaped lines of same shape represent 95% confidence intervals for the effective population sizes.

