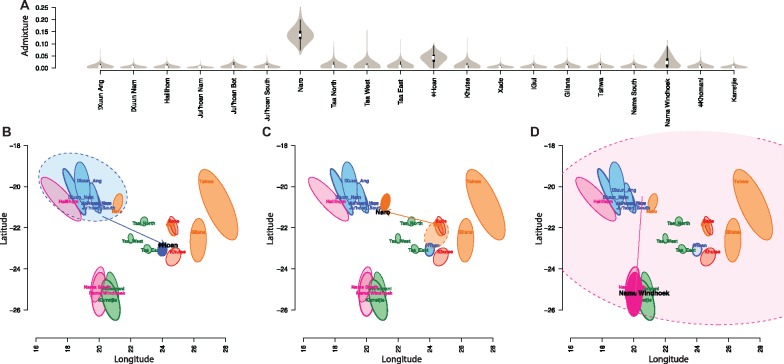
Fig. 3.
Proportions of admixture among masked Khoe-San when analyzed under the isolation-by-distance model with migration and mixture allowed (A). Geogenetic map of the Khoe-San where the source of admixture is coloured (95% CI) and admixture into the ǂHoan (B), Naro (C), and Nama Windhoek (D) populations are indicated.

