Figure 1.
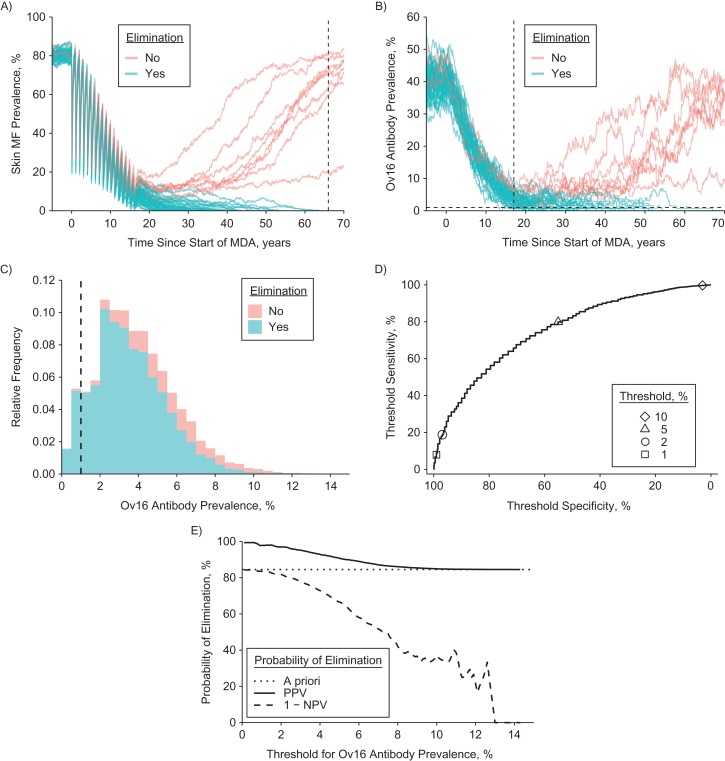
Overview of analytical steps to evaluate the predictive value of Ov16 antibody prevalence. The figure considers the procedure for a single scenario, which for illustrative purposes we take to represent a setting with precontrol community microfilarial load of 55 microfilariae (mf) per skin snip (equivalent to skin mf prevalence of ~80%) and 6 years of annual mass drug administration (MDA). In this example, Ov16 positivity is assumed to be lifelong; patterns are qualitatively similar when based on the assumption of instant seroreversion. Note that the jagged appearance of the curves is due to the stochastic nature of the simulations. A) Using ONCHOSIM, we first predict trends in the prevalence of skin mf up to 50 years after the last MDA round and classify repeated simulations (graph lines) as resulting in either elimination or ongoing transmission. Here, we only show 50 of the 10,000 repeated runs performed, of which 8 did not result in elimination. B) From exactly the same repeated simulation runs, we extracted the predicted prevalence of Ov16 antibodies in selected age groups (example here: children of aged <10 years). C) We then extracted the frequency distribution of Ov16 antibody prevalence across repeated simulations, 1 year after the last MDA round, and stratified it by simulation outcome in terms of elimination (colored areas) and a chosen threshold for Ov16 antibody prevalence (vertical dashed line, here set at 1%). See Table 1 for the resulting classification of simulations and the calculation of sensitivity, specificity, and positive and negative predictive value of Ov16 antibody prevalence. D) We subsequently plotted threshold sensitivity versus threshold specificity for the range of threshold values in a receiver operator characteristic curve. E) Finally, we plotted positive predictive value (PPV, probability of elimination when Ov16 prevalence is under the threshold) and 1 minus negative predictive value (NPV, probability of elimination when Ov16 antibody prevalence is above the threshold) against the range of threshold values (horizontal axis). Note that when interpreting this figure, the threshold value (x-axis) is decided on before observing the Ov16 antibody prevalence (i.e., the x-axis represents the predefined threshold and not the observed Ov16 prevalence).

