
FIGURE 6.
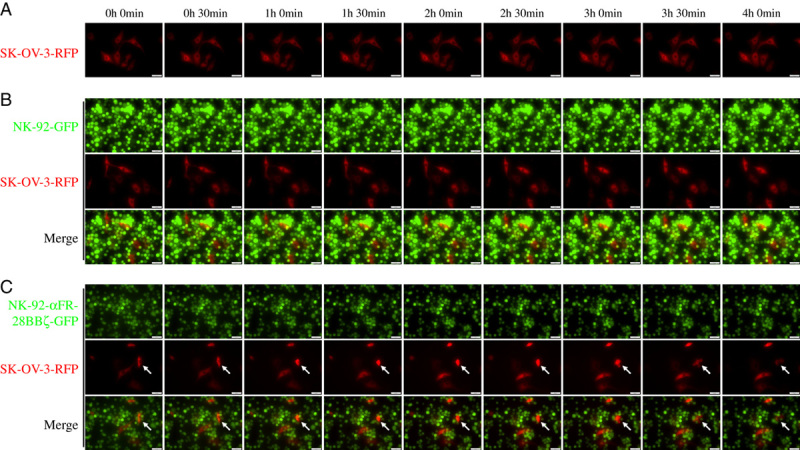
Live cell imaging of NK-92-αFR-28BBζ-GFP cell killing of SK-OV-3-RFP cells. A, SK-OV-3-RFP cells were cultured alone. B, SK-OV-3-RFP cells cocultured with NK-92-GFP cells. C, SK-OV-3-RFP cells cocultured with NK-92-αFR-28BBζ-GFP cells. The E/T ratios are indicated in the Materials and methods section. Scale bar: 50 μm. The arrows indicate SK-OV-3-RFP cells killed by NK-92-αFR-28BBζ-GFP cells.