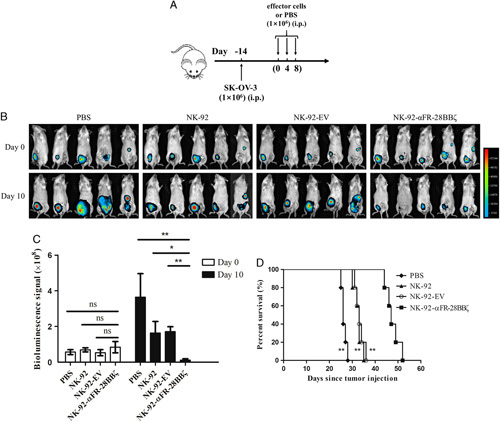
FIGURE 7.

In vivo antitumor activity of NK-92-αFR-28BBζ cells. A, Schematic representation of the construction of mouse xenograft model of ovarian cancer and treatment procedures. B, Ovarian cancer development was monitored by in vivo bioluminescence imaging. Images taken at day 0 and day 10 of the experiment are shown. C, Quantification summary of bioluminescence signal intensity in each group shown in (B). The data are expressed as the means±SEM of 5 mice for all groups. *P<0.05; **P<0.01; ns, P≥0.05. D, Kaplan-Meier survival curves of tumor-bearing mice treated with PBS, NK-92 cells, NK-92-EV cells, or NK-92-αFR-28BBζ cells. **P<0.01, compared with the NK-92-αFR-28BBζ group.
