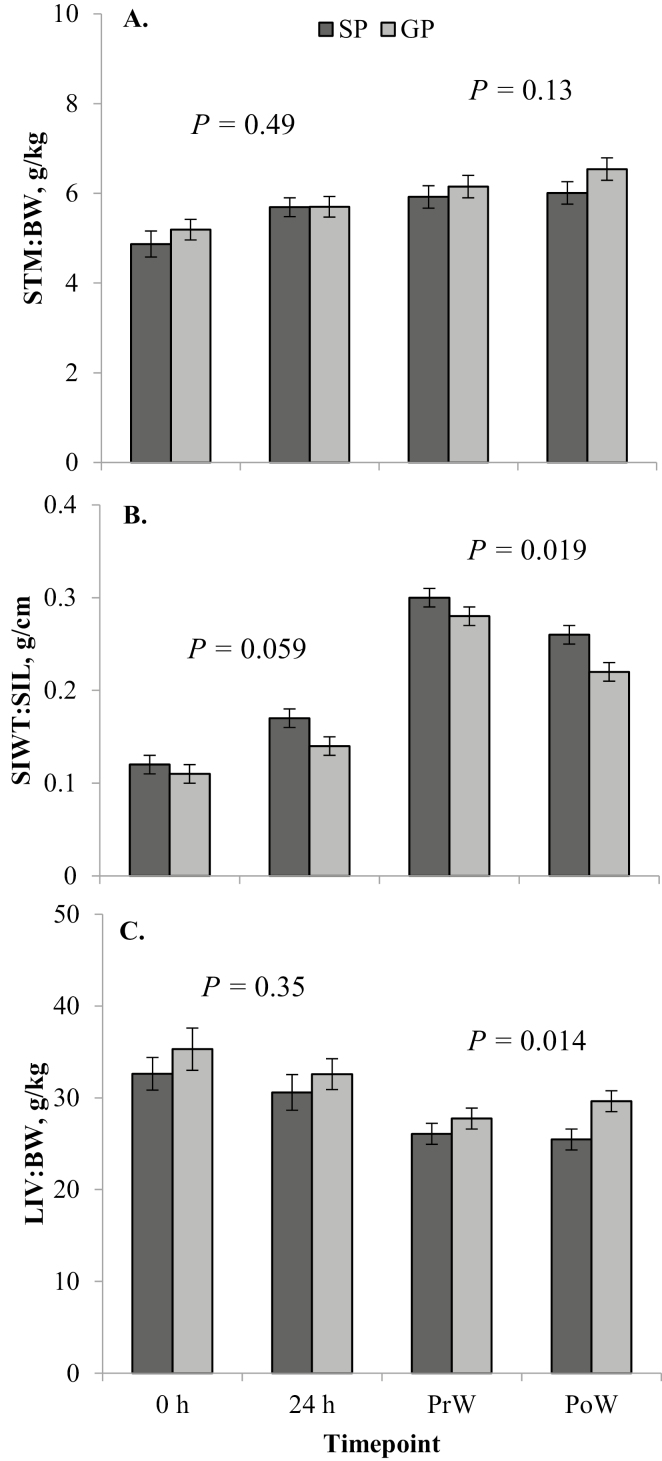
Figure 1.
Least square means (± SE) from the linear mixed model analysis of relative gastrointestinal tract (GIT) growth parameters for each dam parity treatment (gilt progeny, GP; sow progeny, SP) at each time point (birth, 0 h; 24 h after birth, 24 h; weaning, at approximately 29 d of age; PrW; and 24 h after weaning, PoW), including stomach weight relative to body weight (STM:BW; A); weight of the small intestine relative to its length (SIWT:SIL; B); and liver weight relative to body weight (LIV:BW; C). P-values given are for the main effect of dam parity within that cohort (birth, 0 and 24 h; weaning, PrW and PoW).

