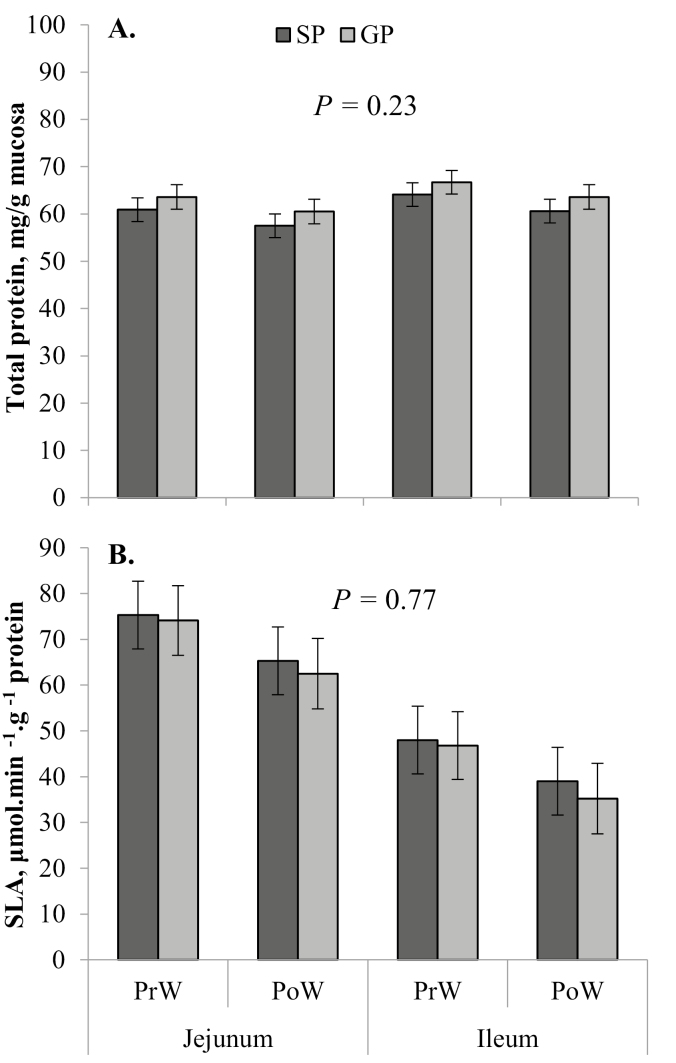
Figure 3.
Least square means (± SE) from the linear mixed model analysis of total mucosal protein (A) and specific lactase activity (SLA) per gram of protein (B) in the proximal jejunum and distal ileum at each weaning cohort time point (weaning, at approximately 29 d of age; PrW; and 24 h after weaning, PoW). P-value given is the main effect of dam parity.

