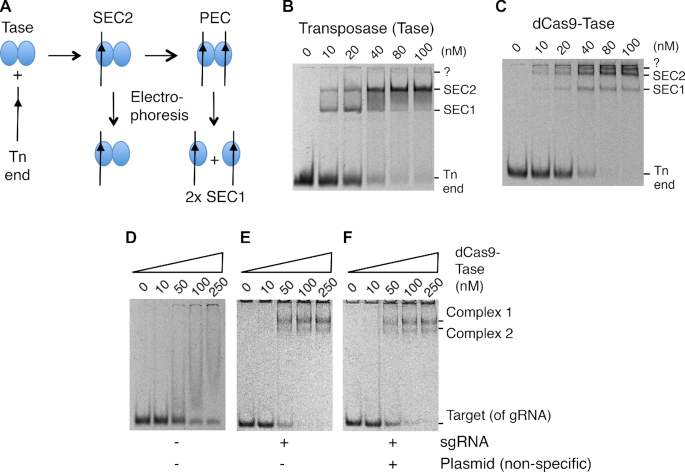
Figure 3.
EMSA analysis of the dCas9-transposase fusion protein. (A) Illustration of protein–DNA complexes formed during the transposition reaction and decomposition of the PEC during electrophoresis. (B) EMSA of purified Hsmar1 transposase on a TBE-buffered 7% polyacrylamide gel. Reactions contained 10 nM of a 70 bp Cy5-labeled oligoduplex encoding a transposon-end. Bands were visualized on a Fujifilm FLA-3000 Fluorescence Laser Imaging Scanner. (C) EMSA as in part B but with the indicated amounts of the dCas9-transposase fusion protein without sgRNA. The band marked ?, just below the wells, might represent the PEC, which is detected with the wild-type transposase if the PEC is artificially stabilized (16). (D–F) the EMSAs were as in part B but with the purified dCas9-transposase fusion protein with its sgRNA. Reactions contained 10 nM of a 70 bp Cy5-labeled oligoduplex complementary to sgRNA-7. When present, the sgRNA was preassembled in a 1:1.5 molar excess to the protein prior to the EMSA. The non-specific competitor plasmid was 1 μg of pRC2301 per binding reaction.

