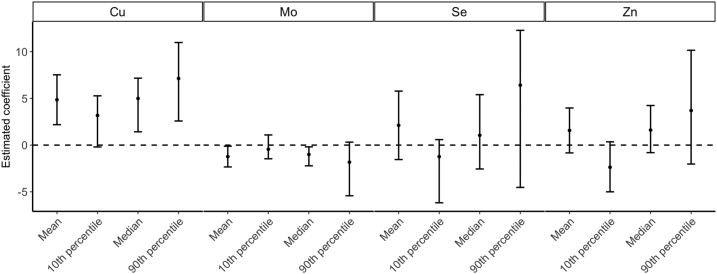
Figure 1.
Distribution changes in glucose level from the 1-hour glucose load test as a function of 50% increase in each metal(loid). Results were obtained by running multivariable adjusted linear regression and quantile regressions on the 10th, 50th, and 90th percentiles of the glucose level. All models were adjusted for age, race/ethnicity, educational level, full-time employed/student, marital status, family history of diabetes, parity, prepregnancy BMI, physical activity, and gestational week at blood sampling. The error bars represent the 95% CIs of the estimates. Cu, copper; Mo, molybdenum; Se, selenium; Zn, zinc.

