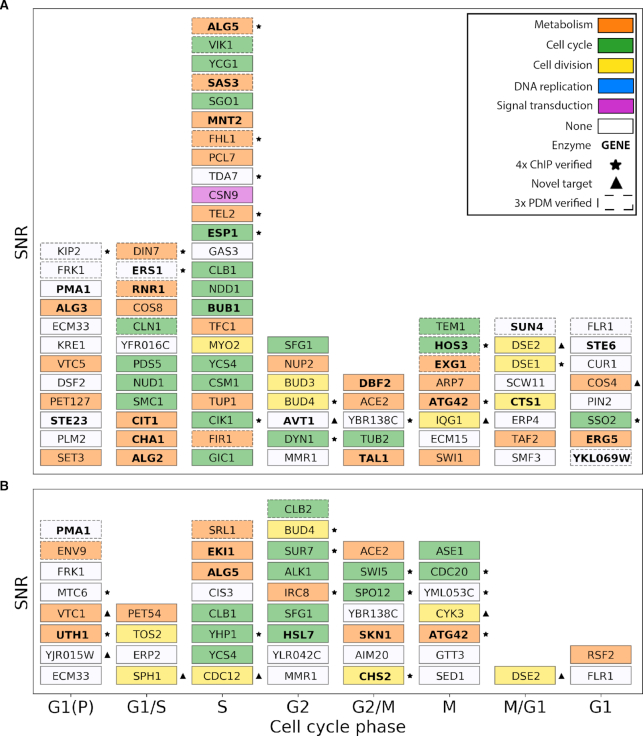
Figure 6.
Stack plot of target genes identified by ChIP-exo in logarithmic phase that have a cell cycle-regulated peak expression level (17). (A) Fkh1 target genes. (B) Fkh2 target genes. Within each column a higher position on the y-axis indicates a higher maxPeak SNR. The x-axis indicates the phases of peak expression of genes, as reported (17). The color for each target gene indicates its major biological function if identified in GEMMER (30). Targets marked with an asterisk are verified by all four (4x) ChIP studies, whereas targets marked with a triangle indicate novel target genes that have not been reported in the previous ChIP studies. Targets identified as significant by all three PDMs are shown with a dashed border.

