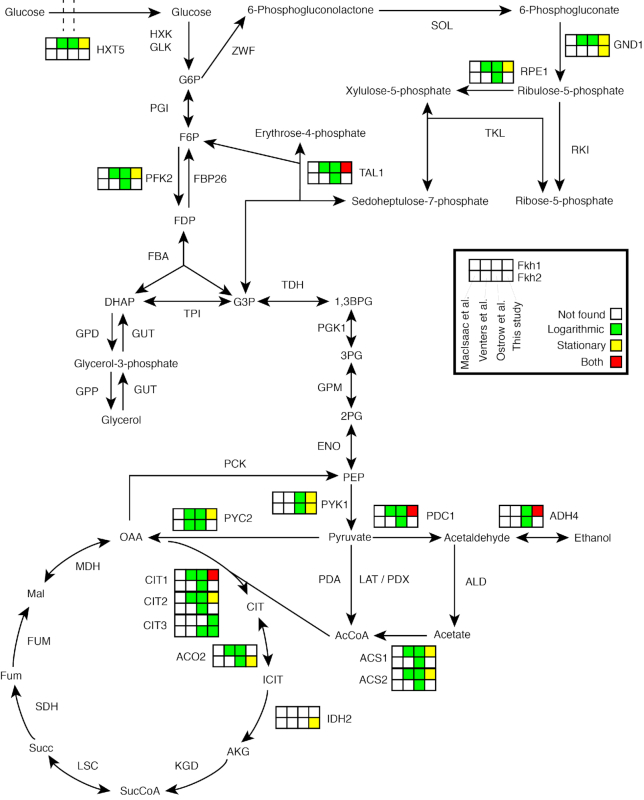
Figure 7.
Overview of metabolic enzymes in central carbon metabolism that are targets of Fkh1 and Fkh2. Each enzyme is associated with eight squares divided in two rows (Fkh1, top row; Fkh2, bottom row) representing data analysis of four different genome-wide studies: MacIsaac et al., Venters et al., Ostrow et al. and this study. Empty squares indicate genes that were not retrieved as significant targets, whereas colored squares indicated a positive evidence. A distinction between the results in logarithmic and stationary phases is visualized through the color of the squares (see the figure insert). Isoenzymes that have no available evidence in any of the four studies were neglected. In some cases, metabolic enzymes may have no associated squares when no isoenzyme is available with an experimental validation.

