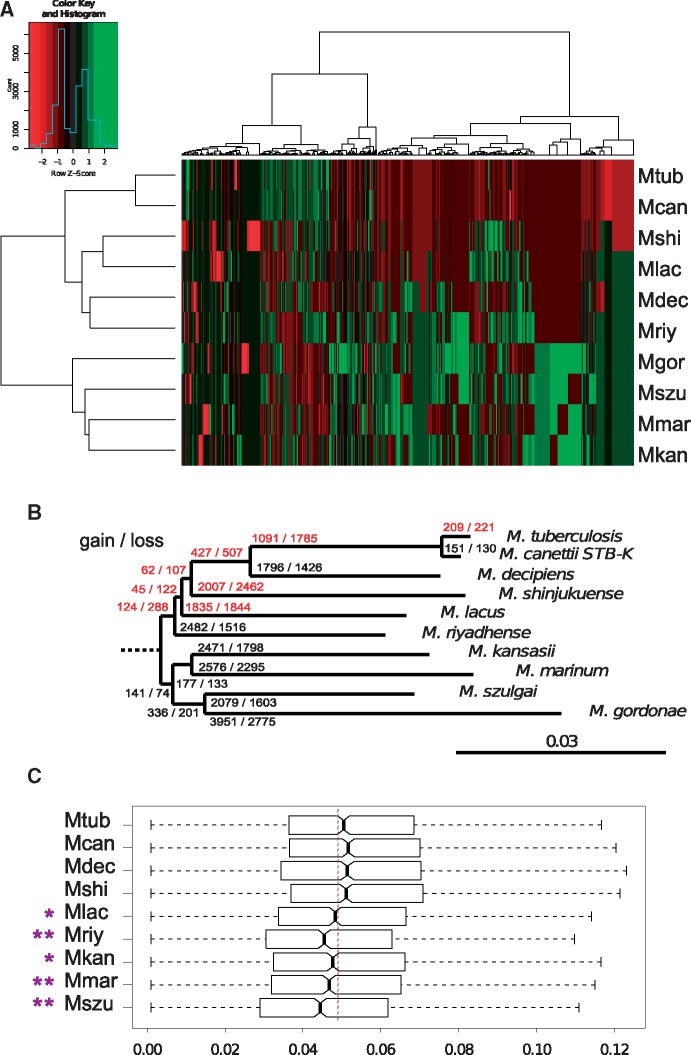
Fig. 2.
—Genomic evolution in MTBAP lineage. (A) Color coded table representing a heatmap for which the rows and columns were sorted by hierarchical clustering approaches. The row tree shows the clustering of MICFAM protein families based on species profile similarity calculated by the Ward agglomerative hierarchical clustering algorithm. The column tree represents the clustering of species based on MICFAM profile. Red: under-represented gene families. Green: over-represented gene families. Color-key for Row Z-scores is shown together with a histogram indicating the number of MICFAM protein families associated with each of the Z-scores. (B) Estimated gene gain and loss in the MTBAP lineage and the MGS–MKM outgroup. Variable genome parts of the MTBAP lineage and the MGS–MKM outgroup were computed using the MICFAM tool with a 50% amino-acid identity threshold and 80% alignment coverage. A table representing presence or absence of gene families for each species was then analyzed by Gain Loss Mapping Engine. Red: branches showing more gene loss than gene gain. (C) dN/dS distribution of core-genome orthologs as compared with the M. gordonae outgroup. Bold bars indicate the median dN/dS values for each species. Notch estimates correspond to 95% confidence intervals for median values. Box edges represent 25th and 75th percentiles. Whiskers represent estimated extreme values. Mcan, M. canettii STB-K; Mdec, M. decipiens; Mshi, M. shinjukuense; Mlac, M. lacus; Mriy, M. riyadhense; Mkan, M. kansasii; Mmar, M. marinum E11; Mszu, M. szulgai; Mgor, M. gordonae.

