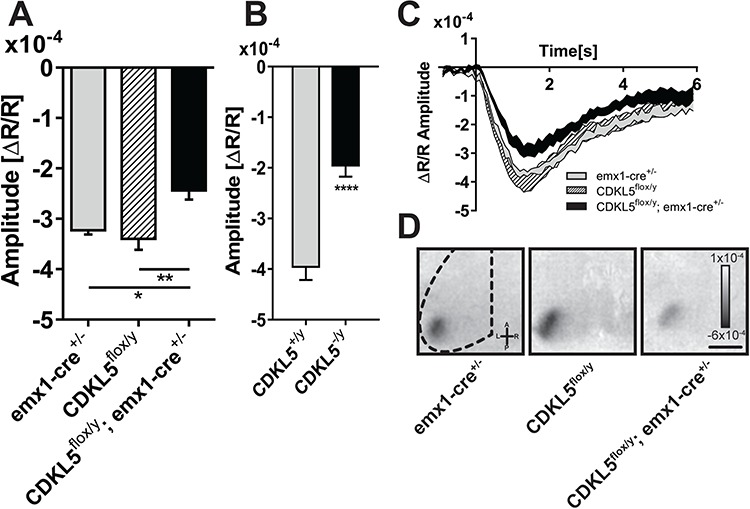
Figure 5.

Cortical visual responses are impaired in cKO mice with deletion of CDKL5 in cortical excitatory neurons. (A) Quantitation of the average amplitude of the intrinsic signal between the experimental groups, cKO, floxed controls (CDKL5flox/y) and emx1-CRE driver controls (emx1-CRE+/−), showing a significant reduction of the evoked visual responses in cKO mice with respect to both control groups (one-way ANOVA P = 0.004; post hoc Holm–Sidak’s multiple comparisons test, emx1-CRE+/− versus cKO, P = 0.0342; CDKL5flox/y versus cKO, P = 0.0043). (B) Quantitation of the average amplitude of the intrinsic signal in CDKL5 null animals showing a significant reduction with respect to controls (two-tailed Student’s t-test P < 0.001). (C) Average time course of the intrinsic signal in the V1 after visual stimulation for the experimental groups in (A). Each area represents mean ± SEM for all the mice in the group. (D) Representative images of a typical intrinsic signal response to visual stimulation localized in the V1. Dark areas represent active portions of brain tissue. *P < 0.05; **P < 0.01; ***P < 0.001. Scale bar (C) is equal to 1.8 mm. Error bars represent SEM.
