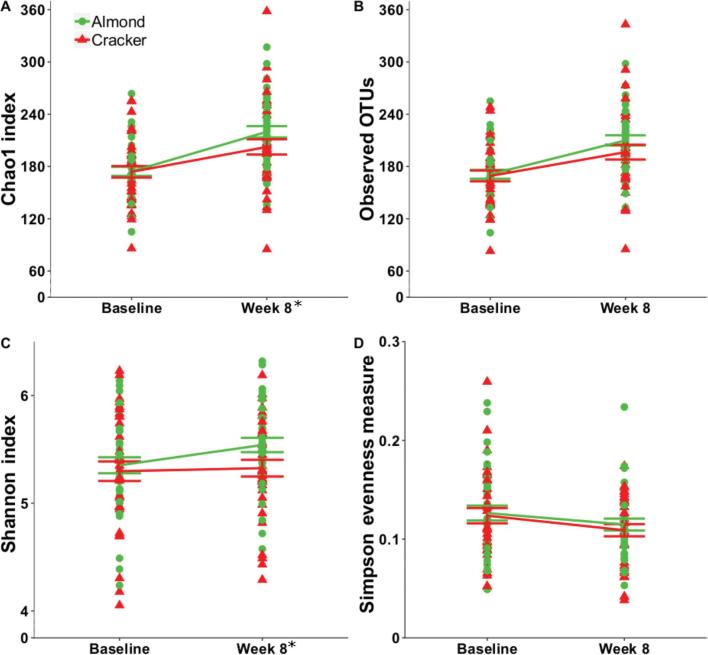
FIGURE 1.
Alpha-diversity indices (calculated from raw abundances). (A) Chao1 index, (B) observed OTUs, (C) Shannon index, and (D) Simpson evenness measure of college freshmen in the almond and cracker groups at baseline and week 8 of the intervention. Values are individual data points representing each participant at baseline and week 8. Means ± SDs of the 2 snack groups at baseline and week 8 are also plotted. Analyses were conducted using 1) linear mixed model with snack (almond or cracker) as between-subject factor, time (baseline or week 8) as within-subject factor, and participant as random factor; and 2) analysis of covariance with baseline value as covariate and snack as between-subject factor. *Snack effect (adjusting for baseline value), P < 0.05. Almond: n = 38, cracker: n = 35. OTU, operational taxonomic unit.

