Figure 7.
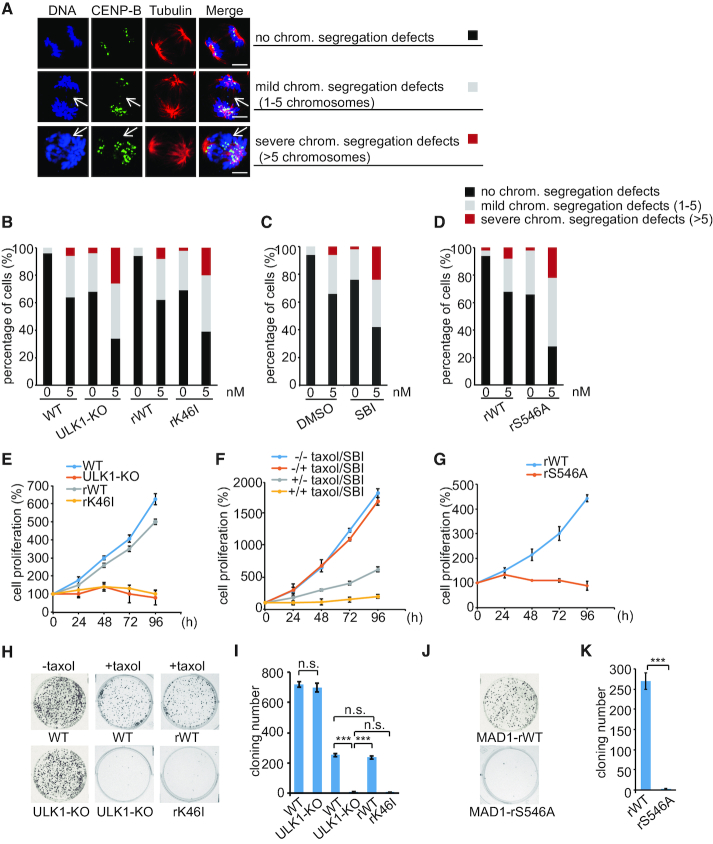
Inhibition of ULK1 increases the cancer cells sensitivity to taxol. (A) Immunofluorescence images of cells with different chromosome segregation defects. Cells were synchronized by thymidine (2 mM) double block and released into fresh medium for 9 h. ‘No chrom. segregation defects’, ‘Mild chrom. segregation defects’ or ‘Severe chrom. segregation defects’ indicate cells with 0, 1–5, or more than 5 chromosomes segregation defects in anaphase, respectively. (B) HCT116 WT cells, ULK1-KO cells, rWT cells and rK46I cells were treated with thymidine for 24 h and then released into medium with or without 5 nM taxol for 9 h before staining for DNA and quantification. (C) HCT116 WT cells were treated with or without 2 μM SBI throughout the course of the experiment. Cells were treated with thymidine for 24 h and then released into fresh medium or into medium containing 5 nM taxol for 9 h before staining for DNA and quantification. (D) A set of RNAi-resistant rescue forms of MAD1 plasmids (MAD1-rWT or rS546A) were stably transfected into HCT116 MAD1-KD cells. Cells were treated with thymidine for 24 h and then released into fresh medium or into medium containing 5 nM taxol for 8.5 h before staining for DNA and quantification. (E) HCT116 WT cells, ULK1-KO cells, ULK1-rWT cells and ULK1-rK46I cells were treated with taxol (5 nM). After 24, 48, 72 and 96 h, the cells were harvested and counted to generate a growth curve. (F) HCT116 WT cells were treated with or without 2 μM SBI throughout the course of the experiment. Cells were treated with taxol (5 nM). After 24, 48, 72 and 96 h, the cells were harvested and counted to generate a growth curve. (G) A set of RNAi-resistant rescue forms of MAD1 plasmids (MAD1-rWT or rS546A) were stably transfected into HCT116 MAD1-KD cells. Cells were treated with taxol (5 nM) for different times, then harvested and counted to generate a growth curve. (H) HCT116 WT cells, ULK1-KO cells, ULK1-rWT cells and ULK1-rK46I cells were treated with or without taxol (5 nM). After 2 weeks, the cloning formation was analyzed with Crystal Violet staining. (I) Quantification of the colony numbers in (H). Asterisks indicate significance (the Tukey test; ***: P < 0.001). (J) Colony formations of indicated treatment in (G). (K) Quantification of the colony numbers in (J).

