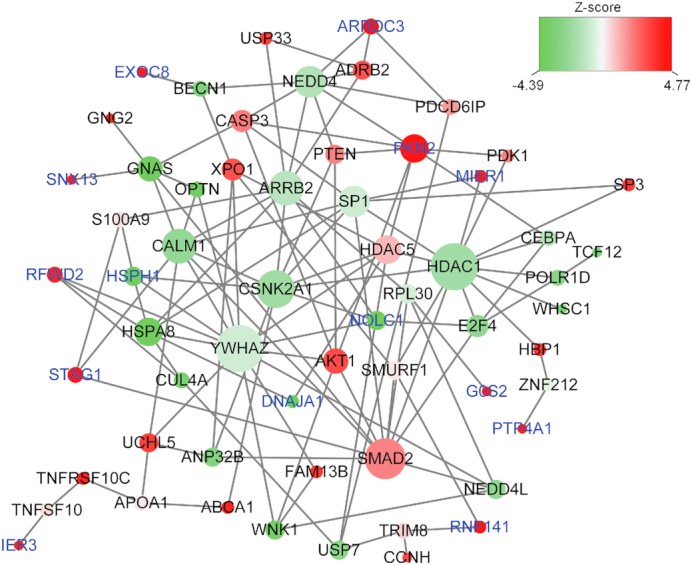
FIGURE 2.

Diet-related subnetwork derived from protein–protein interaction. Each node represents 1 gene, whereas each edge represents the interaction between 2 genes. The nodes are colored to represent their association with dietary score: red represents a strong positive association, and green represents a strong negative association. The node size is proportional to the number of edges that the node connects to. Gene labels in blue represent those that were significantly associated with DGAI (false discovery rate <0.05).
