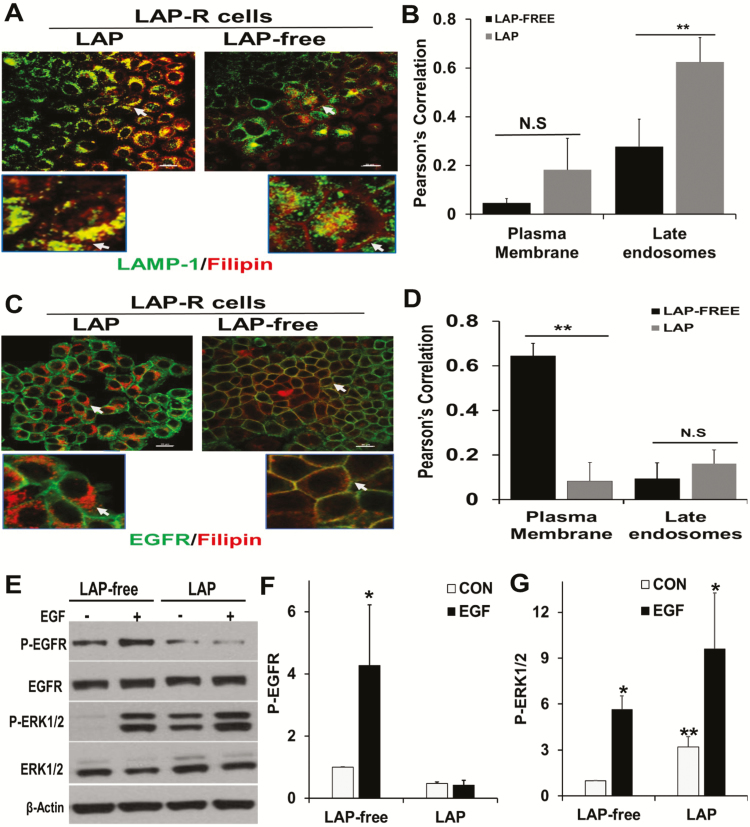
Figure 6.
Withdrawal of lapatinib from lapatinib-resistant cells restored EGFR-dependent ERK1/2 activation. (A) LAP-R cells were grown on glass coverslips and processed as depicted in Figure 3C. Cells were washed, fixed in PBS-buffered 3.7% formaldehyde and stained with LAMP-1 and filipin as in Figure 3B. (B) Co-localization of residual cholesterol and LAMP-1 in the plasma membrane and late endosomes using the Nikon advanced research imaging software. Pearson’s correlation denotes the extent of co-localization. **P = 0.02 for co-localization of filipin and LAMP-1 (n = 3 cells). (C) Parental and LAP-R cells were treated continuously with lapatinib or without lapatinib as in Figure 3C, and whole-cell cholesterol (filipin staining) and EGFR were visualized by confocal microscopy as described in Figure 3B. (D) Co-localization of filipin and EGFR as assessed using Nikon advanced research imaging software. Pearson’s correlation indicated the extent of co-localization of filipin and EGFR. **P = 0.01 for co-localization of filipin and EGFR (n = 3 cells). N.S. denotes not significant. (E) LAP-R cells were maintained in lapatinib containing medium or in medium without lapatinib as in Figure 3C. Cells were then serum-starved overnight and stimulated with EGF for 5 min. Activation of EGFR and ERK1/2 were assessed by western blotting. Total ERK1/2 and EGFR as well as ACTB were used as loading controls. (F and G) Densitometric quantification of phospho-EGFR (F) and phospho-ERK1/2 (G). Bars represent activated EGFR or ERK1/2 relative to control from two independent experiments. *P < 0.05 versus control (no EGF) and **P < 0.05 for basal activation of ERK1/2 in LAP-free treatment versus continuous lapatinib treatment.

